[DC-03-033] Acoustic Imaging of the Oceans
Acoustic remote sensing is used to collect information about the shape and material properties of the seabed and subsurface. Sensors, traditionally deployed from ships and boats, are increasingly being installed on remotely operated or autonomous vehicles. These active remote sensing techniques transmit sonar (sound/acoustic) pulses and measure the two-way travel time for the pulse to be reflected, scattered, or refracted from the seafloor or subsurface and returned to the sensor. Knowing the speed of sound in water, sediment and rock, the relative position of the target on or below the seafloor can be determined. Absolute positioning of the target is determined by the integration of the sensor platform with ancillary Global Navigation Satellite Systems (GNSS) and motion referencing units (MRU). Reflected energy is used to determine the shape (or morphology) of the target, and scattered energy is used as a proxy for material properties. Applications of these methods have expanded significantly in recent years as coastal and marine landscapes are being transformed due to climate change impacts and anthropogenic forcing, with cables, pipelines, offshore renewables, and a broad range of complex engineering structures now ubiquitous on the seafloor.
Tags
Introduction
Quinn, R. (2025). Acoustic Imaging of the Oceans.
Explanation
- Underwater Acoustics
- Navigation and Positional Control
- Mapping the Shape of the Seabed
- Mapping Material Properties of the Seabed
- Mapping Beneath the Seabed
- Societal Applications
1. Underwater Acoustics
We know more about the surface of other planets in our solar system than we do about Earth. For example, we can download a global digital elevation model (DEM) of Mars at a 200 m resolution from the world wide web, and we can download a 100 m DEM of Earth’s moon. Yet the best global DEM we have of Earth presently is a 450 m resolution surface from the General Bathymetric Chart of the Oceans (GEBCO) 15 arc second model. Therefore, we know the surface of our moon twenty times better than Earth, and the surface of Mars six times better than our own planet.
Why? Over 70 percent of Earth's surface is covered in water, and the oceans hold about 97 percent of all this water. To obtain information about the shape and material properties of the seabed and sub-surface, we need to irradiate the ocean environment with a suitable radiation. Satellite and airborne remote sensors which traditionally rely on electromagnetic waves for Earth observation are ideal for mapping the terrestrial component of our planet (and the surface of Mars and our Moon). However, salt water is strongly conductive and therefore highly dissipative, meaning electromagnetic waves are attenuated rapidly underwater, limiting their use for remote sensing of the ocean. Conversely, acoustic (sound or sonar) waves can propagate large distances in the ocean and through the seafloor, offering an ideal solution for underwater remote sensing. However, acoustic surveys are inherently time-consuming and expensive as sensors need to be deployed from vessels in direct contact with the marine environment.
Acoustic sensors are used underwater to: (a) detect and locate obstacles (e.g. submarines, fish, sediment), (b) transmit information or data (e.g. between vessels or instruments), and (c) investigate the shape and material properties of the natural and anthropogenic environment of the seafloor and sub-surface. Most seabed mapping sonars are active sensors, in that they transmit an acoustic wave and receive reflected and scattered energy using transceivers.
Acoustic remote sensing methods rely on the propagation of acoustic waves by mechanical perturbation through an elastic medium (i.e., a gas, liquid, or solid). The mechanical properties of the propagating medium dictate the velocity of the acoustic pulse. In the ocean, the acoustic wave velocity (v) typically varies from 1,450 to 1,550 ms−1 and is dependent on pressure, salinity, and temperature (Lurton, 2010). Seawater density (ρ) is typically 1,030 kgm−3 and is dependent on the same physical parameters as velocity. Acoustic signals are characterized by their frequency (f, measured in Hz) and period (T, measured in s), where T = 1/f. The frequencies used in active underwater acoustics typically range from 1 Hz to 1 MHz, with source choice dependent on application, water depth, and resolution required. Wavelength (λ, measured in m) is the spatial equivalent of wave period and corresponds to the distance travelled by the wave during one period of the signal with velocity v. Typically objects are resolved at one quarter the wavelength of the acoustic source. So, for example, for a sound velocity of 1,500 ms−1, a 1 kHz source will resolve an object larger than 0.375 m, and a 100 kHz source will resolve an object larger than 0.004 m.
Two of the main constraints on the usable frequencies for a particular application are acoustic wave attenuation in the water column (energy loss due to viscosity in the propagating medium) and source directivity (the directional effectiveness of the sound source) (see Lurton, 2010). High-frequency acoustic sources are preferred for their resolution and directivity, but high frequencies are attenuated more readily and therefore travel only short distances. This implies compromise and a challenge in terms of survey design and instrument choice.
The transmitted acoustic wave may be deflected in many ways as it propagates through the water column, the seabed and subsurface; it may encounter air bubbles, fish, suspended sediment, rough seafloors, and subsurface targets. In each case, a proportion of the sound is reflected and scattered in various directions, including back toward the survey instrument. Specular reflection is caused by plane interfaces – that is, the incident wave is reflected in a direction symmetrical to the direction of arrival (like light off a mirror), with a loss of amplitude (Lurton, 2010). Scattering is generally caused by rough interfaces and discrete objects in the water column and at the seafloor. The ratio between reflected and scattered contributions decreases at higher frequencies (Lurton, 2010).
2. Navigation and Positional Control
Precise navigational and positional control are essential for the collection of high-resolution acoustic remotely sensed data. To locate features and objects on the seabed, we need to know precisely where the sensor is located below the sea surface and which portion of the seabed is being radiated or sampled at any given time. This control is achieved through a combination of position fixing (latitude, longitude, and altitude above a reference datum), heading, speed, and attitude (heave, roll, pitch, yaw) information. Positional information for the sensor is most often established using a Global Navigation Satellite System (GNSS) receiver and the area of the seabed radiated at any given time is addressed by measuring the motion of the survey platform (and hence the sensor) using a motion referencing unit (MRU). This system uses a combination of accelerometers and gyroscopes to track the pitch, roll, heave, and yaw on the sensor.
3. Mapping the Shape of the Seabed
The shape (or morphology) of the seabed, and any objects or infrastructure lying on it, are investigated using echosounders. The simplest and least expensive form is the singlebeam echosounder which estimates water depth by transmitting a single narrow acoustic beam vertically downwards and measures the time it takes to be returned to the sensor. Depth is calculated by multiplying the time by the speed of sound in water (approximately 1500 ms-1) and dividing by two (to account for the two-way path of the sound wave). Fisheries sounders work on the same principal, and use the signal returned from animals in the water column to identify fish species, investigate animal behaviour, and for fisheries stock assessments.
Multibeam echosounders (MBES) are now the most common offshore surveying tools. As the name suggests, they use multiple acoustic beams (up to 240) to detect the seafloor. Because of its multiple beams it can map a swath of the seabed under the ship, in contrast to a single beam sounder which only maps a point below the ship. With the capability to cover 100% of the seafloor (Figure 1), multibeam echosounders have become the industry standard for hydrographic and geoscientific applications. Deepwater systems are designed for regional survey and operate in the frequency range of 12 kHz (deep ocean mapping) to 30 kHz (continental shelf investigations). The large size and weight of these MBES transceivers limits their installation to deep-sea vessels. Shallow-water systems typically operate at 100–200 kHz and are designed for hydrographic survey of the continental shelves.

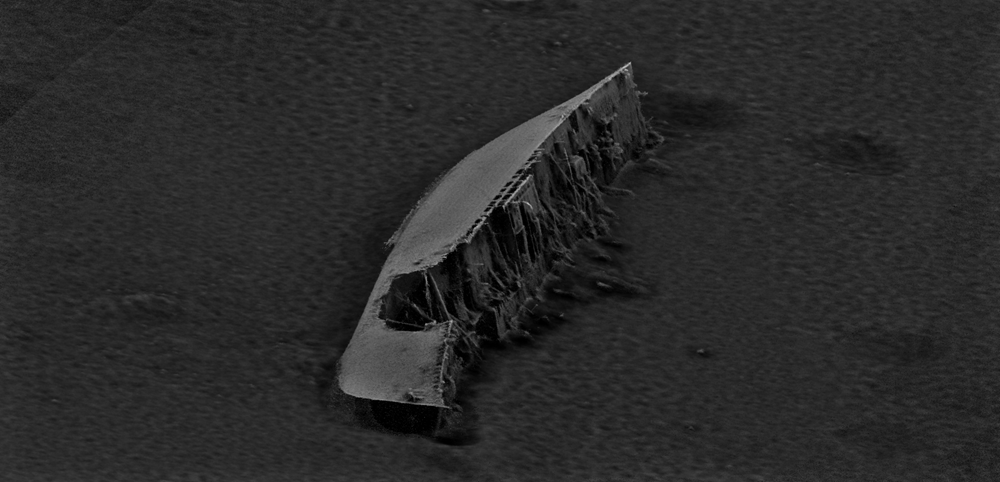
High-definition systems (Figure 2), operating between 300 and 500 kHz, are used for high-definition work and object detection (Lurton, 2010). Their small size and weight make them ideal for small-vessel deployment and for mounting on remotely operated vehicles (ROVs), autonomous underwater vehicles (AUVs) and uncrewed surface vessels (USVs). Optimal high-definition 3D imaging with multibeam echosounders is achieved through maximising the pulse rate and using the highest frequency and shortest pulse lengths available (Westley et al., 2019).
4. Mapping Material Properties of the Seabed
Sidescan sonar (SSS) is a swath system that provides acoustic images of the seabed generated by two side-looking transceivers mounted on a towfish. The SSS insonifies a corridor of the seafloor underneath the towfish using a highly directed source. SSS relies on backscattered energy and allows users to differentiate material types by measuring the amount of energy returned from each portion of the seafloor. Coarse-grained material scatters the most energy, and fine-grained material scatters the least. SSS systems typically operate as dual-frequency systems, with 100 and 500 kHz sources common. 100 kHz sources are often used for reconnaissance-scale low-resolution wide-area surveys, and 500 kHz sources for detailed high-resolution site-specific surveys.
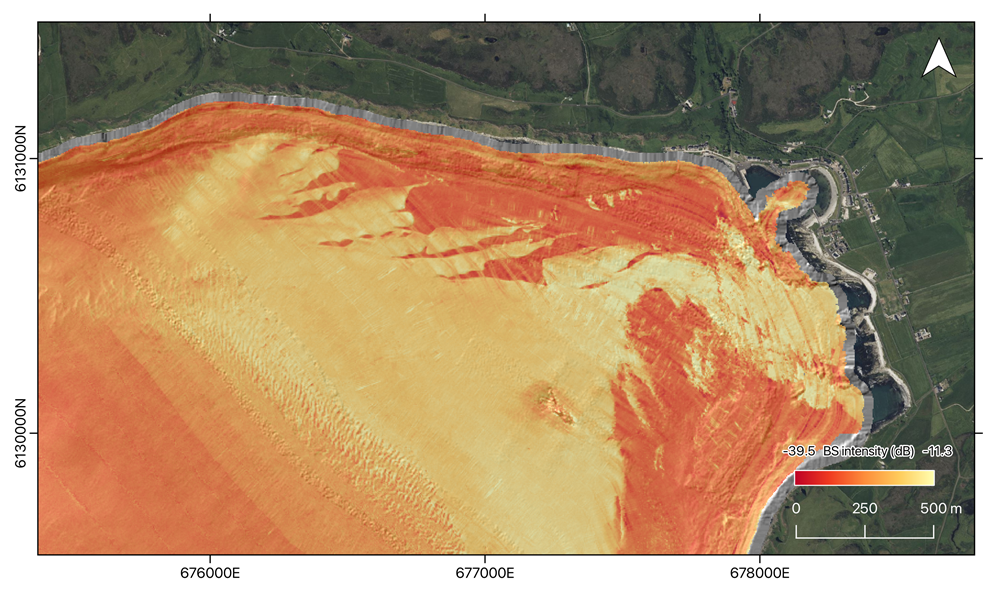
Two other more modern types of swath systems are now also commonly employed to collect backscatter data (Figure 3): multibeam echosounders and interferometric sonars (also termed bathymetric sidescan sonar). Each of these systems has its merits. In simple terms, MBES systems offer higher-resolution bathymetric data with low-order backscatter data as a by-product, whereas interferometric systems offer lower-order bathymetric data and true sidescan. Whatever system is used to collect backscatter data, ground validation of the backscatter signatures is always required to derive secondary products such as substrate or habitat maps of the seabed. Ground validation is most often established using direct (sediment samplers or corers) or indirect (video or stills imagery) methods.
5. Mapping Beneath the Seabed
Sub-bottom (seismic) profilers are used to investigate the layers of sediment and geological structures beneath the seabed. They provide detailed cross-sectional profiles of the sub-surface to investigate the composition, thickness, and stratigraphy of different layers of sediment and rock, and objects buried beneath the seafloor. They are also routinely used in geohazard detection (e.g., shallow gas, submarine landslides) in the offshore engineering industry. Profilers are most often hull- or towfish-mounted and comprise a transducer for the transmission of the pulse and hydrophone for the reception of the returned signal. A low-frequency acoustic pulse is directed vertically at the seafloor via the transducer. When these pulses hit substrate, they penetrate the seafloor before being refracted and reflected from horizons and targets in the sub-surface.
Pre-1990s most sub-bottom profilers were relatively crude, designed solely to generate pseudo cross-sections of the sub-surface. The resulting data were limited in terms of signal analysis because the sensors typically had narrow bandwidths and the systems were engineered with nonlinear and un-calibrated electronics, leading to poor pulse repeatability. The introduction of frequency modulated (Chirp) systems in the 1990s addressed these limitations, leading to the development of sub-bottom profilers with repeatable source-signatures for very high-resolution seismic investigations. The repeatable source-signature means a greater probability of recognising signal in the presence of noise.
6. Societal Applications
Most of the world’s largest cities are in coastal zones (Timmerman and White, 1997) and more than 75% of people are expected to live within 100 km of the coast by 2025 (European Environment Agency, 2006). Coastal and marine landscapes are being transformed as a result, with cables, pipelines, monopiles, bridges and a broad range of complex engineering structures now ubiquitous on the seafloor. This extensive development and construction in marine and coastal systems is driving a phenomenon known as ‘ocean sprawl’, removing or altering marine habitats through the addition of ocean engineering. Accordingly the applications of acoustic remote sensing have greatly increased over the past two decades, from the pre-development stage of largescale ocean engineering projects to post-development investigations of impacts on the seabed. Acoustic remote sensing therefore finds applications in areas as diverse as fisheries science (Munnelly et al., 2024), seabed morphopdynamics (Boggild et al., 2024), marine archaeology (Westley et al., 2019), unexploded ordnance detection (Ściegienka and Blachnik, 2024), ocean engineering (Xiong et al., 2023), habitat alteration (Pijanowski and Brown, 2022), offshore renewables (Asensio et al., 2025), mineral prospection (Kirkpatrick and Green, 2021), and geohazard detection (De Falco et al., 2024).
Perhaps the most exciting recent development in seafloor mapping is the Seabed 2030 project, established in 2017 by The Nippon Foundation and General Bathymetric Chart of the Oceans (GEBCO) (Mayer et al., 2018). The collaboration was originally formed to see how ocean mapping might support the UN’s Sustainable Development Goal 14: ‘to conserve and sustainably use the ocean, seas and marine resources for sustainable development’ after they recognised that the absence of detailed bathymetric data was hindering our capacity to manage marine resources sustainably and safeguard coastal communities worldwide. Within Seabed 2030 there are four regional centers that cover the Southern Ocean, the Arctic and North Pacific Ocean, the Atlantic and Indian Oceans, and the South and West Pacific Ocean. These feed data products into a global data center in the United Kingdom. The IHO Data Centre for Digital Bathymetry (DCDB) serves as the long-term archive for Seabed 2030. Ultimately Seabed 2030 aims to compile all available seabed mapping data from around the world into a seamless digital map of the world’s ocean floor by 2030 (Mayer et al., 2018). Assuming this goal is achieved, we will have a global DEM of Earth to rival or exceed those currently available for Mars and the Moon in terms of data resolution. The wider societal benefits and applications of Seabed 2030 include seabed mapping innovation, EEZ mapping in the absence of a national hydrographic organization, subsea cable installation planning and design, tsunami propagation and storm surge modelling, offshore renewable energy installation planning and design, climate change modelling, Small Island Developing States (SIDS) sea level rise and coastal inundation modelling, marine biodiversity mapping, government policy development, and ocean exploration and discovery (Seabed 2030 – NLA International, 2024).
References
- Asensio, I., Rodríguez-Méndez, L., Vegas, N. et al. (2025). Integrated geological study in an offshore renewable energy test site: a case from the Basque continental shelf (Bay of Biscay, Spain). Environ Earth Sci 84, 7.
- Boggild, K., Li, M.Z., Eamer, J.B.R. and Stacey, C.D. (2024) Geomorphology and sediment mobility on sand banks: A study of Dogfish Bank, Hecate Strait, Northeast Pacific Ocean. Earth Surface Processes and Landforms, 49(13), 4485–4505.
- De Falco, G., Conforti, A., Di Martino, G., Innangi, S., Simeone, S., Tonielli, R., & Budillon, F. (2024). Geohazard features of the western Sardinia. Journal of Maps, 20(1).
- European Environment Agency. (2006). The changing faces of Europe's coastal areas. Publications Office. EEA Report 6 ⁄ 2006. OPOCE, Luxembourg.
- Kirkpatrick, L.H., and Green, A.N. (2021). Mapping diamondiferous palaeo-shorelines in complicated terrain: seismic and GIS-based methods from the inner shelf of southern Namibia. Geo-Mar Lett 41, 41.
- Lurton, X. (2010). An Introduction to Underwater Acoustics—Principles and Applications, 2nd ed.; Springer: Chichester, UK.
- Mayer, L., Jakobsson, M., Allen, G., Dorschel, B., Falconer, R., Ferrini, V., Lamarche, G., Snaith, H., & Weatherall, P. (2018). The Nippon Foundation—GEBCO Seabed 2030 Project: The Quest to See the World’s Oceans Completely Mapped by 2030. Geosciences, 8(2), 63.
- Munnelly, R. T., Castillo, J. C., Handegard, N. O., Kimball, M. E., Boswell, K. M., & Rieucau, G. (2024). Applications and analytical approaches using imaging sonar for quantifying behavioural interactions among aquatic organisms and their environment. ICES Journal of Marine Science, 81(2), 207-251
- Pijanowski, B. C. & Brown, C. J. (2022). Grand challenges in acoustic remote sensing: Discoveries to support a better understanding of our changing planet. Frontiers in Remote Sensing, 2, 824848.
- Ściegienka, P. & Blachnik, M. (2024). On the Development of an Acoustic Image Dataset for Unexploded Ordnance Classification Using Front-Looking Sonar and Transfer Learning Methods. Sensors, 24(18), 5946.
- Seabed 2023-NLA International (2024). The Nippon Foundation – GEBCO Seabed 2030 Project Compendium of Seabed Mapping Use Cases.
- Timmerman, P. & White, R. (1997) Megahydropolis: coastal cities in the context of global environmental change. Global Environmental Change, 7, 205–234.
- Westley, K., Plets, R., Quinn, R., McGonigle, C., Sacchetti, F., Dale, M., McNeary, R. & Clements, A. (2019). Optimising protocols for high-definition imaging of historic shipwrecks using multibeam echosounder. Archaeological and Anthropological Sciences, 11, 3629-3645.
- Xiong, C., Lian, S. & Chen, W. (2023). An ensemble method for automatic real-time detection, evaluation and position of exposed subsea pipelines based on 3D real-time sonar system.J Civil Struct Health Monit 13, 485–504.
Learning outcomes
-
1893 - Explain how sound is used to map the seabed and sub-surface.
Explain how sound is used to map the seabed and sub-surface.
-
1894 - Describe the key mapping techniques used in acoustic remote sensing.
Describe the key mapping techniques used in acoustic remote sensing.
-
1895 - Summarize some of the societal applications of acoustic remote sensing in the context of a growing population and a changing world.
Summarize some of the societal applications of acoustic remote sensing in the context of a growing population and a changing world.
Related topics
Additional resources
- Correa, T.B.S., Grasmueck, M., Eberli, G.P., Verwer, K., Purkis, S.J. (2013). Deep Acoustic Applications. In: Goodman, J., Purkis, S., Phinn, S. (eds) Coral Reef Remote Sensing. Springer, Dordrecht. https://link.springer.com/chapter/10.1007/978-90-481-9292-2_10
- Marine Geological and Biological Habitat Mapping (GEOHAB) is an international association of marine scientists studying biophysical (i.e., geologic and oceanographic) indicators of benthic habitats and ecosystems as proxies for biological communities and species diversity. https://geohab.org (accessed 12 May 2025)
- NOAA, Bathymetric Data Viewer: Download singlebeam and multibeam bathymetry data from around the world. https://www.ncei.noaa.gov/maps/bathymetry/ (accessed 25 February 2025)
- Seabed 2030: Through Seabed 2030, The Nippon Foundation and General Bathymetric Chart of the Oceans (GEBCO) have committed to building the necessary technical, scientific, and management framework to compile all available seabed mapping information into a seamless digital map of the world’s ocean floor by 2030. https://seabed2030.org (accessed 25 February 2025)
- SeafloorMapping.net is an archive of links offered as a service from to assist seafloor mapping and marine/coastal GIS specialists and non-specialists. https://seafloormapping.net (accessed 12 May 2025)
- University of New Hampshire Center for Coastal and Ocean Mapping-Joint Hydrographic Center (UNH/CCOM-JHC). GIS Portal containing a wide range of open mapping web apps and data layers, including those for the US continental shelf and global Seabed 2030. https://gis.ccom.unh.edu/portal/home/ (accessed 12 May 2025)