[DA-043] GIS&T in Natural Water Resources Management
Natural water resources are a particularly pressing issue for the US and the broader world given human and environmental reliance on water for survival. The topic spans concerns and applications in several fields including law, economics, regional planning, and engineering. Of particular importance to resource managers are water quality and quantity, watershed management, and flood management, among others. Geographic Information Science and Technology (GIS&T) contains principles and methods well-suited to meeting the demands of natural water resources management. Not only are GISs an effective tool for storing and managing spatial data associated with water resources, but they also contain the means to capture and model various environmental phenomena. Within the context of natural water resources, GIS&T aids in both monitoring and predicting changes, as well as visualizing and delineating the extent of natural occurrences, such as groundwater basins and watersheds. Data sources can range from satellite-based remote sensing to create digital elevation models (DEM) and watershed boundaries, to on-the-ground point monitoring. When integrated, these data aid practitioners and decisionmakers in identifying the distribution, hazards, and current and potential uses of natural water resources.
Tags
Author & citation
Bayer, E. and Albrecht, J. (2025). GIS&T in Natural Water Resource Management. The Geographic Information Science & Technology Body of Knowledge (Issue 2, 2025 Edition), John P. Wilson (ed.). DOI: 10.22224/gistbok/2025.2.2.
Explanation
- Introduction and Background
- GIS&T Applications in Natural Water Resources Management
- Conclusions
1. Introduction and Background
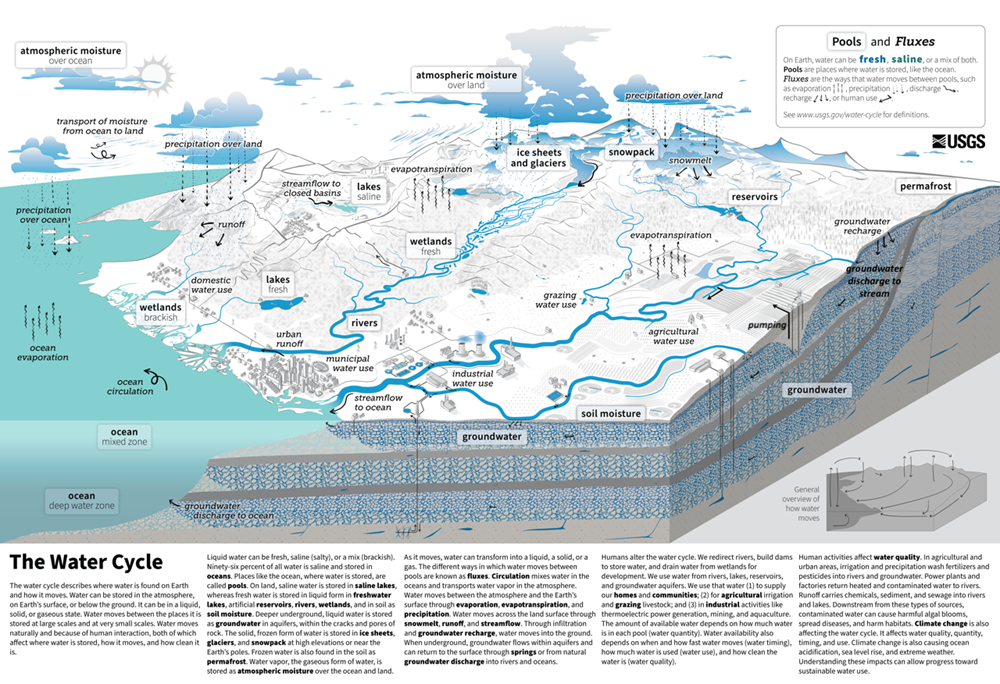
Water as a natural resource is distributed differentially throughout the world; some regions have too much, others too little, and yet others face issues of poor quality. Around 97% of the water on Earth is saltwater, and only about 3% is freshwater, with most of that locked away in glaciers (USGS, 2018). Surface waters such as rivers and lakes are readily visible, but natural water resources also critically include glaciers, springs, and groundwater. These components are integral to the hydrological cycle and overall water availability. The volume carried by these flowing and non-flowing bodies of water vary throughout the year based on seasonal and annual changes in precipitation and climate. The ways in which water moves globally throughout the Earth’s ground, surface, and atmosphere comprise the water cycle. Figure 1 highlights the various complex natural and human pathways through which resources travel in the water cycle. Groundwater infiltration and recharge, as well as surface runoff are included as key processes. Human uses of water include industrial, agricultural, and household applications.
In the US, the largest protection for water resources came in 1972 with the Clean Water Act (CWA). The CWA set the structure for the regulation of the discharge of pollutants and surface water quality standards. Additionally, the CWA made it unlawful for individuals to discharge pollutants from a point source without a permit and recognized the need to address non-point source pollution problems (US EPA, 2023). Laws have followed since then to protect waters, including the Safe Drinking Water Act and the Resource Conservation and Recovery Act.
Quantifying this natural resource and the ways in which it moves is vitally important to human and environmental health. GIS technologies are well-suited to this task. With the help of remote sensing, flood mapping, and other methods, coupled with analytical processes like watershed analysis, practitioners can model and predict challenges in the field of natural water resources. Hydrological models, such as SWAT, HEC-HMS, and MODFLOW 9, offer valuable insight for engineers by emphasizing aspects of the water cycle, generation of runoff, groundwater recharge, and the effects of land use and climate change on water supply and demand. GIS technology complements this by providing the spatial data tools and visualization capacities essential for constructing, refining, and simulating hydrological models across various scenarios and scales. The integration of GIS with these models allows for spatially explicit parameterization and analysis of outputs (Jain, 2016).
2. GIS&T Applications in Natural Resources Management
Data on water resources is frequently collected via remote sensing. Aerial photography and satellite imagery provide large collections of information regarding the location and scale of surface waters, such as rivers and lakes, at high temporal and spatial resolutions. They also aid in the identification and monitoring of water bodies that may otherwise be difficult to access. Moreover, water has distinct spectral properties that multispectral and hyperspectral imaging is capable of detecting (Warner, 2017).
Remote sensing, however, frequently provides a single “snapshot” in time, unlike continuous, active systems such as flow gauges. Still, remote sensing technologies like LiDAR (see Light Detection and Ranging) are very useful for the creation of DEMs that inform floodplain delineations, watershed boundaries, and other hydrological features. LiDAR, for instance, directly measures three-dimensional surface features, providing highly accurate sub-canopy topography and vegetation structure data crucial for detailed hydrological assessments (Wasser, 2024). It is also useful for monitoring changes over time in reservoir size and height, stream channels, and other temporally significant deviations (see Airborne LiDAR Bathymetry, forthcoming).
GISs are useful not only as a management tool for remotely sensed spatial data, but also for the analysis and modeling of various metrics. These include watershed analysis, surface and groundwaters, measurements of water quality, and flood management.
2.1 Watershed Analysis
A watershed is an area of land that drains surface or groundwater to a common outlet point (see Watersheds and Drainage Networks). They can vary substantially in size and volume of water transported and are separated by ridgelines such as hills or mountains, or by man-made constructions like levees and dams. Formerly, the delineation of these boundaries was done through field surveys (Berelson et al., 2004) or manual delineation on topographic maps, however, GIS tools exist to delineate watershed boundaries from topography or DEMs (Eash et al., 2018). GIS leverages DEMs to automatically identify flow direction, flow accumulation, and delineate watershed and stream networks (GWP, n.d.). Given that water follows changes in elevation from high to low, elevation models present a useful tool for determining these boundaries. Watershed analysis also helps to inform flow determinations, in particular, the direction and volume that might travel through a given path based on different variables like precipitation or soil permeability. Hydrological models such as SWAT and HEC-HMS 9, in turn, inform rainfall-runoff determinations which are important for water quality and flood management.
Many watershed modeling approaches exist; they are differentiated in part by the algorithms used, whether their inputs and parameters are stochastic or deterministic, and if the spatial representation is lumped or distributed (Daniel et al., 2010). Lumped models assume that a watershed is a single unit in which parameters and variables are averaged across the watershed. It is a simpler hydrological model; however, it neglects the relationship between surface and groundwaters, among other hydrologic characteristics. On the other hand, distributed and semi-distributed models incorporate more spatial variability in hydrological processes (Daniel et al., 2010). Models like SWAT, for example, divide a watershed into multiple sub-watersheds and further into Hydrologic Response Units (HRUs) based on land use, soil type, and slope, allowing for more detailed, physically-based simulations (NASA, n.d.). Applications of these models can include “aquifer vulnerability mapping, surface water and groundwater quality remediation, floodplain studies, assessment of surface water impact from groundwater withdrawal, water supply design, river basin management and planning, assessment of catchments changes due to land use changes and irrigation and run off predictions in ungauged watersheds” (Daniel et al., 2010). Thanks to the computing power provided by GIS, which are capable of handling large datasets that support heterogeneous land characteristics, there has been an overall trend toward distributed models that provide a more holistic representation of watersheds. Hydrological models, however, are not the only use for GIS within this context. Remote sensing and GIS technologies have also been used as part of suitability analyses to identify ideal sites for soil and water conservation structures (Pandey et al., 2011).
2.2 Surface Water and Groundwater
Surface and groundwaters store and move water that is vital to people and the environment. GISs are very useful for identifying features in the landscape, such as different vegetation types, urban areas, or bodies of water. Because water absorbs solar radiation, it often appears black in infrared remote sensing imagery, simplifying the identification of rivers and lakes. In one 2021 study, researchers presented a novel method for using artificial intelligence (AI) in combination with GIS to identify surface bodies of water with 86% accuracy (Li et al., 2021). These techniques are particularly useful for identifying and quantifying water resources in remote or dangerous locations. Additionally, thanks to NASA’s Earth Observing System (NASA, n.d.), there is an extensive record of satellite imagery and data relating to water (among other phenomena) dating back nearly 30 years. This record allows practitioners to contrast water resources, such as lake extent, through time. For example, time-series analysis of satellite imagery (e.g., from Landsat or MODIS) is widely used to monitor changes in water body extent, vegetation health as an indicator of water stress, and land use impacts on water resources over decades (Bailey et al., 2025). An Uzbekistan case study, for instance, utilized satellite data within an ArcGIS framework to monitor agricultural water consumption and detect water stress zones dynamically (Esri, 2013).
Groundwater on the other hand is not directly visible in the same way as surface water from standard optical remote sensing. Its assessment and identification often rely on indirect methods or subsurface investigations. However, it is frequently inferred or mapped for potential in the landscape by identifying characteristics that are associated with it, such as geology, landforms (e.g., springs, wetlands), vegetation indicators, porosity and topographical depressions, to create groundwater potential zones (Waikar & Nilawar, 2014). Advanced techniques like the GRACE satellite mission can detect large-scale changes in terrestrial water storage, which includes groundwater, by measuring variations in Earth's gravity field (Eash et al., 2018). Furthermore, InSAR technology can monitor land subsidence associated with groundwater extraction (Lukens et al., 2022). In one study, authors used remote sensing and GIS to identify sites suitable for artificial recharge of groundwater aquifers in regions of India (Agarwal et al., 2013). They did so by identifying various parameters in the landscape, including slope, runoff potential, and morphometric features, while using GIS to store and analyze this data. Each of these studies highlights the vital role that GIS plays in quantifying and ultimately informing how we can preserve our limited natural water resources.
2.3 Water Quality
Another important application for GIS lies in water quality monitoring. Water quality refers generally to the physical, chemical, and biological characteristics (Ritchie et al., 2003). There is no one standard of water quality; for example, human needs are very different from what might be necessary for agriculture or hydroelectric power generation. Still, water pollution is a large and growing concern, exacerbated by things like agriculture and construction which can negatively impact surface water quality and the hydrological cycle (Cheng et al., 2022). As a result, monitoring and assessment are vital to managing water quality. Traditionally, monitoring occurs via sensors and gauges at select points or via in-situ sample collection. While these methods often have spatial components, they can be limited in spatial coverage for comprehensive regional assessments of water quality and management, though point-based gauges can offer high temporal resolution at specific locations. Moreover, many practitioners have underscored that in-situ monitoring is time-consuming, labor intensive, and at times cost prohibitive (Adjovu et al., 2023; Yang et al., 2022).
GIS technologies, in particular remote sensing, provide a unique solution to complement in-situ measurements, allowing for data collection on a large scale and filling a global gap in spatiotemporal data (Adjovu et al., 2023). Because various factors such as suspended sediments and dissolved organic matter, chlorophyll, and oils affect the reflectance of water, practitioners can use remote sensing to track changes in these parameters (Ritchie et al., 2003). Researchers have gone even further to obtain more robust quantitative estimates by coupling this spectral data with calibration curves from in-situ observations. Data can even be retrieved on phenomena with optically weak or inactive properties, such as total nitrogen, total phosphorous, and pH, because they correlate with optically active parameters (Adjovu et al., 2023). Importantly, remote sensing can do so for thousands of water bodies at a time. Remote sensing can provide broad spatial coverage, which is advantageous for regional assessments, while in-situ measurements offer detailed point-specific data (Li et al., 2025).
Beyond satellite-based remote sensing, advancements in the use of unmanned aerial vehicles, or drones, have improved the flexibility and specificity with which practitioners can collect regional spatiotemporal data (Adjovu et al., 2023). On the processing end, machine learning (ML) algorithms and AI aid in timely monitoring, identifying relationships between parameters, and generating predictions (Yang et al., 2022). AI and ML are increasingly used to enhance the interpretation of remote sensing data for water quality assessment and to model complex relationships between pollutants and environmental factors (Li et al., 2025). Some argue that these new technologies, coupled with an existing understanding of the interactions between land use and water quality, will produce more robust prediction bases and reduce the costs associated with water quality monitoring (Cheng et al., 2022). Water quality assessments, in turn, help engineers and planners monitor changes and trends, and ultimately identify potential sources of pollution and recommend water treatment and protection mechanisms (Chapman, 1996; Sener, Sener & Davraz, 2017; Li, Zhang & Xu, 2021).
2.4 Flood Management
Though many of the concerns about natural water resources involve instances of drought and dwindling water supply, there are risks associated with instances of too much water, as is the case with flooding. Effective water resource management must therefore address both scarcity and excess (Teng et al., 2017). GIS and flood inundation models aid in the identification and delineation of areas that are prone to flooding due to severe rainfall events, river flooding, storm surges, or sea-level rise (Teng et al., 2017). Using remotely sensed satellite imagery and on-the-ground assessments, GISs integrate data from hydrological models, DEMs, land use, and population metrics to synthesize flood maps which in turn support emergency response and decision making. For example, the integration of GIS with hydrologic-hydraulic models allows for detailed assessment and visualization of flood inundation areas under various drivers like design storms, land use changes, and sea-level rise (Biazar et al., 2025).
Flood maps and inundation models help engineers and planners evaluate flood risk and mitigation measures. Practitioners can then simulate the implementation of mitigation measures such as sea walls and dikes for future flooding. They can also perform infrastructure analysis to determine the effects that flooding might have on bridges, roads, and other structures that play a critical role in evacuation and recovery. The combination of inundation models and infrastructure flood models, such as Hazus MH, also play a large role in risk modeling; together, practitioners can compute risk factors and determine probabilities and acceptable levels of risk. These decisions then inform response management, legislation, such as zoning, and engineering projects (Lin et al., 2019; Ran & Nedovic-Budic, 2016).
3. Conclusion
Clean, usable freshwater is a limited resource, so good management is key to conservation. Yet, the management of natural water resources can only be as effective as the methods and tools employed to quantify and locate them. As a result, hydrological models with the capacity to integrate many of the factors outlined above, have critical implications for management. A prime example in the US is the National Oceanic and Atmospheric Administration’s National Water Model (NWM). The NWM is a high-resolution hydrological model developed to simulate and predict the movement, distribution, and availability of water across the US (Cosgrove et al., 2024). Most notably, it provides real-time forecasts for river streamflow, surface water, and flood potential by integrating up-to-date weather and river observations. While aiming for accuracy, the performance of such large-scale models can vary depending on regional characteristics and data inputs. The NWM complements and expands on existing hydrological monitoring programs to provide fine-scale temporal and spatial data for these regions, in addition to locations that lack existing forecasting systems. Even high-resolution models like the NWM operate with discretized units (e.g., specific reach scales or catchments for reporting), meaning some level of parameter lumping or averaging occurs relative to the continuous natural system, though they represent a significant advancement over traditional lumped models (NASA. n.d.). GISs are employed for more than modelling change and risks; they are also used to map current and prospective infrastructure needs, such as water, sewer, and irrigation networks. Human consumption and infrastructure play a large role in water resource management more broadly--one that would likely benefit from having its own Body of Knowledge entry.
Ultimately, novel methods in GIS and advancements in analysis-ready data, AI, and parallel- and super-computing are poised to confront future challenges. These include the increasing integration of Artificial Intelligence and Machine Learning (AI/ML) for enhanced predictive accuracy in hydrological models (Li et al., 2025), the use of real-time data streams from sensors and satellites for dynamic monitoring (GWP, n.d.), advanced remote sensing applications like GRACE and InSAR for comprehensive water storage assessment (Eash et al., 2018), and the development of integrated surface-groundwater models for holistic system understanding (NASA, n.d.). However, since part of the role of natural water resources management is to distribute both water and risk mitigation strategies, there are concurrent ethical concerns regarding water and environmental equity such as who has access to water, who is at risk of flooding, and why? Consequently, GIS practitioners must not only be familiar with the tools at their disposal, but also the range of impacts that their analyses might have. Even in these instances, GIS methods are poised to tackle problems of equity (Heckert & Rosan, 2018). Overall, it is clear that natural water resources management and projects benefit from spatial modeling and optimization techniques enabled by GIS&T.
References
- Adjovu, G. E., Stephen, H., James, D., & Ahmad, S. (2023). Overview of the Application of Remote Sensing in Effective Monitoring of Water Quality Parameters. Remote Sensing, 15(7), 1938.
- Agarwal, R., Garg, P. K., & Garg, R. D. (2013). Remote Sensing and GIS Based Approach for Identification of Artificial Recharge Sites. Water Resources Management, 27(7), 2671-2689.
- Bailey, R. T., Abbas, S., Arnold, J. and M White (2025). SWAT+MODFLOW: A new code for integrated surface-subsurface hydrologic and water management modeling. Copernicus Egusphere Preprint.
- Berelson, W. L., Caffrey, P. A., and Hamerlinck, J. D. (2004). Mapping hydrologic units for the National Watershed Boundary Dataset. Journal of the American Water Resources Association 40(5): 1231-1246.
- Biazar, S. M., Golmohammadi, G., Nedhunuri, R.R., Shaghaghi, S. and K. Mohammadi. (2025). Artificial intelligence in hydrology: Advancements in soil, water resource management, and sustainable development. Sustainability, 17 (5), 2250
- Chapman, D. V., World Health Organization, UNESCO & United Nations Environment Programme. (1996). Water quality assessments: a guide to the use of biota, sediments and water in environmental monitoring / edited by Deborah Chapman, 2nd ed. E & FN Spon.
- Cheng, C., Zhang, F., Shi, J., & Kung, H.-T. (2022). What is the relationship between land use and surface water quality? A review and prospects from remote sensing perspective. Environmental Science and Pollution Research, 29(38), 56887-56907.
- Corson-Dosch, H., Nell, C., Volentine, R., Archer, A. A., Bechtel, E., Bruce, J. L., Felts, N., Gross, T. A., Lopez-Trujillo, D., Riggs, C. E., & Read, E. K. (2022). The Water Cycle. Water Science School, US Geological Survey.
- Cosgrove, B., Gochis, D., Flowers, T., Dugger, A., Ogden, F., Graziano, T., Clark, E., Cabell, R., Casiday, N., Cui, Z., Eicher, K., Fall, G., Feng, X., Fitzgerald, K., Frazier, N., George, C., Gibbs, R., Hernandez, L., Johnson, D.,…Zhang, Y. (2024). NOAA's National Water Model: Advancing operational hydrology through continental-scale modeling. JAWRA Journal of the American Water Resources Association, 60(2), 247-272.
- Daniel, E. B., Camp, J. V., LeBoeuf, E. J., Penrod, J. R., Abkowitz, M. D., & Dobbins, J. P. (2010). Watershed Modeling Using GIS Technology: A Critical Review. Journal of Spatial Hydrology, 10(2).
- Eash, D.A., Barnes, K.K., O'Shea, P.S., and Gelder, B.K. (2018). Stream-channel and watershed delineations and basin-characteristic measurements using lidar elevation data for small drainage basins within the Des Moines Lobe landform region in Iowa: U.S. Geological Survey Scientific Investigations Report 2017–5108, 23 p.
- Esri (2013). ArcHydro GIS for Water Resources. Redlands, CA: Esri.
- Global Water Partnership (GWP). (n.d.). Integrated Water Resources Management (IWRM) Action Hub.
- Jain, N. C. (2016). Geospatial for sustainable water management. Geospatial World.
- Li, H., Zech, J., Ludwig, C., Fendrich, S., Shapiro, A., Schultz, M., & Zipf, A. (2021). Automatic mapping of national surface water with OpenStreetMap and Sentinel-2 MSI data using deep learning. International Journal of Applied Earth Observation and Geoinformation, 104, 102571.
- Li, J., Liu, H. Sheng, Y., Han, D., Shan, K., Zhu, Z. and X Dai (2025). Investigating groundwater–surface water interactions and transformations in a typical dry–hot valley through environmental isotopes analysis. Water, 17 (6), 775.
- Lin, L., Wu, Z., & Liang, Q. (2019). Urban flood susceptibility analysis using a GIS-based multi-criteria analysis framework. Natural Hazards, 97(2), 455-475.
- Liu, J., Zhang, D., Tang, Q., Xu, H., Huang S, Shang, D., et al. (2021) Water quality assessment and source identification of the Shuangji River (China) using multivariate statistical methods. PLoS ONE 16(1): e0245525.
- National Aeronautics & Space Agency (NASA) GRACE Tellus. (n.d.). Groundwater.
- National Aeronautics & Space Agency (NASA). (n.d.). Missions: Earth Observing System (EOS). Last accessed July 28, 2025.
- Pandey, A., Chowdary, V. M., Mal, B. C., & Dabral, P. P. (2011). Remote sensing and GIS for identification of suitable sites for soil and water conservation structures. Land Degradation & Development, 22(3), 359-372.
- Ran, J., & Nedovic-Budic, Z. (2016). Integrating spatial planning and flood risk management: A new conceptual framework for the spatially integrated policy infrastructure. Computers, Environment and Urban Systems, 57, 68-79.
- Ritchie, J., Zimba, P., & Everitt, J. (2003). Remote Sensing Techniques to Assess Water Quality. Photogrammetric Engineering & Remote Sensing, 69.
- Sener, S., Sener, E., & Davraz, A. (2017). Evaluation of water quality and pollution of the Egirdir Lake (Turkey) using multivariate statistical analysis. Water Science and Technology, 76(3-4), 859-871.
- Teng, J., Jakeman, A. J., Vaze, J., Croke, B. F. W., Dutta, D., & Kim, S. (2017). Flood inundation modelling: A review of methods, recent advances and uncertainty analysis. Environmental Modelling & Software, 90, 201-216.
- US Environmental Protection Agency. (2025, June 10). History of the Clean Water Act.
- US Geological Survey. (2018, June 6). Where is Earth's Water? Water Science School, USGS.
- Waikar, M., & Nilawar, A. P. (2014). Identification of groundwater potential zone using remote sensing and GIS technique. International Journal of Innovative Research in Science, Engineering and Technology, 3(5), 12163-12174.
- Warner, T. A. (2017). Nature of Multispectral Image Data. The Geographic Information Science & Technology Body of Knowledge (3rd Quarter 2017 Edition), John P. Wilson (ed.).
- Wasser, L. A. (2024, September). The Basics of LiDAR - Light Detection and Ranging - Remote Sensing. NEON/Batelle.
- Yang, H., Kong, J., Hu, H., Du, Y., Gao, M., & Chen, F. (2022). A Review of Remote Sensing for Water Quality Retrieval: Progress and Challenges. Remote Sensing, 14(8), 1770.
Learning outcomes
-
1912 - Identify natural water resource types and their importance to society and the environment.
Identify natural water resource types and their importance to society and the environment.
-
1913 - Predict challenges and hazards associated with too much water (flooding), too little water (drought), or water of poor quality.
Predict challenges and hazards associated with too much water (flooding), too little water (drought), or water of poor quality.
-
1914 - Explain the role of remote sensing and DEMs in the quantification and modeling of natural water resources.
Explain the role of remote sensing and DEMs in the quantification and modeling of natural water resources.
-
1915 - Define the characteristics of the physical environment (e.g., topography, land use, soil type, infrastructure density) and data requirements (e.g., DEM resolution, rainfall data) needed to develop a model for flood mapping in urban environments.
Define the characteristics of the physical environment (e.g., topography, land use, soil type, infrastructure density) and data requirements (e.g., DEM resolution, rainfall data) needed to develop a model for flood mapping in urban environments versus less developed or natural environments.
-
1916 - Summarize the importance of high spatial resolution data, particularly DEMs derived from sources like LiDAR, for accurate flood modeling in complex urban environments where infrastructure and micro-topography significantly influence flow paths.
Summarize the importance of high spatial resolution data, particularly DEMs derived from sources like LiDAR, for accurate flood modeling in complex urban environments where infrastructure and micro-topography significantly influence flow paths.
-
1917 - Identify ethical considerations surrounding natural water resources.
Identify ethical considerations surrounding natural water resources.
Related topics
- [AM-04-066] Watersheds and Drainage Networks
- [CV-04-031] Flow Maps
- [DA-032] GIS&T and Natural Resource Management
Additional resources
- USGS Water Resources Mission Area: https://www.usgs.gov/mission-areas/waterresources/maps, including the National Hydrography Dataset (NHD): https://www.usgs.gov/national-hydrography/national-hydrography-dataset
- Arc Hydro GIS Tools for Water Resources: https://www.esri.com/en-us/industries/waterresources/arc-hydro
- HydroSHEDS database: https://www.hydrosheds.org