[KE-04-014] Measuring GIS Return on Investment
In this article, return on investment (ROI) calculations are applied to analyzing the current costs and financial benefits of geographic information systems (GIS) as a GIS management tool. How to develop GIS ROI methodologies to document the current financial value of GIS operations, as well as an outline of a ROI research design without and without GIS, are also included. Before the development and widespread use of GIS by government agencies and private enterprises, maps provided benefits and value to society. Early attempts to catalog the societal and financial benefits from mapping include examples related to geological mapping. An ROI analysis calculates the financial values of all the inputs into a system and all the outputs from the system, and then calculates the differences in value of the inputs and outputs. A key challenge to the growth of the emerging geospatial technology industry was to convince agencies and companies that GIS provided both societal and financial benefits. Companies and agencies often used benefit-cost analysis as a decision support tool when deciding to invest in GIS. But usually there was no effort or requirement by agencies to prove the ROI achieved after a project was completed and put into operation.
Tags
Author and citation
Babinski, G. (2024). Measuring GIS Return on Investment.The Geographic Information Science & Technology Body of Knowledge (2024 Edition), John P. Wilson (Ed.). DOI: 10.22224/gistbok/2024.1.3
Explanation
- Overview
- The Societal Benefit of Maps
- The Societal Benefit of GIS
- Survey of GIS ROI Methods and Studies
- Development of a Local Agency ROI Methodology
- GIS ROI Methodology in Practice
1. Overview
This article discusses the use of return on investment (ROI) calculations related to analyzing the current costs and financial benefits of geographic information systems (GIS) operations. An ROI analysis determines and compiles the cost of all the inputs into a system and the financial value of all the outputs from the system, and then calculates the differences in value of the inputs and outputs (Zerbe & Bellas 2006). If the value of the outputs exceeds that of the inputs, the program has a positive ROI.
Determining the current ROI of a GIS operation for a company, government agency, or other entity, has a variety of uses. It is a useful performance metric. An ROI study is also useful for communicating the financial value of a GIS operation in comparison with other potential uses of financial resources within the entity that the GIS supports.
The manager of a GIS operation competes for financial resources (or defends against cuts to resources) with other business units within the entity. For example, in a year of budget reductions within a city, the entity leadership may have to compare the impact of a $100,000 reduction to GIS versus a similar reduction to the police department or public works department. The police chief or public works manager will likely be able to explain the financial benefits of their departments’ services. Determining GIS ROI provides the GIS manager with similar metrics.
While ROI or benefit-cost analysis (BCA) can be used to estimate future benefits from enhancements or investments in an existing GIS operation, that is beyond the focus of this article.
2. The Societal Benefit of Maps
Before the development and widespread use of GIS by government agencies and private enterprises, maps provided benefits and value to society. The municipal government of ancient Rome mapped the city in the Severan Marble Plan of Rome (Forma Urbis Romae) at a scale of 1:240 (Najbjerg 2016). The development of Portolan Charts in the 13th to 15th Centuries provided a variety of financial benefits to those who used them for commercial shipping and supported an industry of cartographers who compiled data and created the Portolans (Campbell 1987). Plotting and analysis of data related to cholera epidemics in London demonstrated the public health benefits and value of pre-GIS spatial analysis (Snow 1855).
Early attempts to catalog the financial benefits from mapping include examples related to geological mapping. These efforts included cataloging the types of societal benefits with assumed financial benefits at the national level (Bernknopf et al. 1993) and the state level (Bhagwat & Ipe 2000).
3. The Societal Benefits of GIS
The development of the components of geographic information science and technology led to early efforts to implement geographic information systems to support the business functions of government agencies and for academic research. Quantitative and analytic pioneering within geography, including overlay techniques, spatial information management, and geostatistical analysis began to leverage what a map could be used for (Chrisman 2020).
But as GIS was implemented to support the map-dependent business functions of government agencies and the private sector, it became apparent that there were many new additional costs associated with geospatial technology. Once fully implemented GIS would allow a mapping department to eliminate the costs associated with traditional mapping technology and procedures (mylar and velum sheets, specialized cartographic furniture and tools, and map storage, retrieval, and reproduction facilities). In their place, geospatial technology components (computers, specialized software, digital data storage resources, digital data, and various input, display, and output peripherals), needed to be purchased, developed, operated, and maintained.
A key challenge to the growth of the emerging geospatial technology industry was to convince agencies and companies that GIS provided both societal and financial benefits to justify large financial investments and ongoing operating costs.
Societal benefits from GIS are many and often surface when conducting a GIS ROI study. A literature review of social return on investment (SROI) models found that they ‘….aim to assess an intervention under social, economic and environmental points of view, known as the triple bottom line.’ (Corvo, et al., 2022). The role of GIS in helping to reduce employee and customer travel provides both societal and environmental benefits (Burns 1994).
However, justifying the financial costs was often of primary importance to convince decision makers to provide significant capital investment and ongoing operations funding for an agency GIS. The theoretical basis for assessing financial benefits from GIS came from both the GIS consulting world (Antenucci et al., 1991) and from the geospatial technology industry (Thomas & Ospina 2004).
Three basic business cases were commonly proposed to justify most early investment in GIS:
- Making, maintaining, and distributing maps with GIS technology would be less expensive than traditional cartographic methods.
- Providing maps in digital format would make their use more efficient for map end-users.
- There would be other non-quantifiable benefits.
Specific examples of these business cases in practice were utilized by Jack Dangermond to conceptualize 32 common geographic functions of municipal operations (Babinski 2014).
As an example of utilizing a future GIS cost-benefit analysis, a 1991-1992 GIS implementation and financial plan for a large county GIS (PlanGraphics 1992) identified a total projected cost of $22 million, the development of data to support 126 planned end-user applications, and a cost-benefit analysis that projected a 1:1.51 return after 10 years of operation (Figure 1) and break-even after seven years (Figure 2).
It is noteworthy that agencies which rely on a cost-benefit analysis for decision making related to any type of major investment rarely require a later ROI analysis to document actual results.


4. Survey of GIS ROI Methods and Surveys
GIS provides a variety of benefits to society as a whole and to agencies that employ it. To compete for the financial resources required for a viable GIS, key geospatial management competencies include: ’Communicate the value of geospatial technology to decision makers and stakeholders’ and ‘Conduct regular financial analysis.’ (URISA 2012). Effective communication and financial analysis both require a structured understanding of a topic. The benefits to society of a GIS can be structured in terms of past, current, and future benefits, non-financial benefits, financial benefits to society as a whole, financial benefits to the jurisdiction, and the benefit of GIS as public infrastructure.
Society uses budgets to allocate finite financial resources to government agencies (or companies) to provide the essential services that it needs and expects. In democracies, elected officials are the stewards of the jurisdiction’s financial resources, with the expectation that those resources will be allocated to lines of business to maximize the benefits to the constituents. Companies also have finite financial resources with the additional factor that they hope to generate a profit for their owners.
GIS budgets consume a significant portion of a typical agency’s total financial resources. A recent Puget Sound / Seattle area study of 19 local agency GIS budgets found a range of 0.101% to 0.513% and an average of 0.258% of total agency budget for GIS (Babinski 2021). GIS budgets are often a target for reduction or complete elimination to free up financial resources for other programs.
How can GIS compete effectively in the agency budget process, to obtain a reasonable allocation of the jurisdiction’s financial resources to enable it to support its end-users? The key is to communicate the organizational, societal, and financial benefits of the GIS to the end-users and to the decision-makers responsible for allocating financial resources.
The financial benefits of a GIS can be analyzed by a return on investment (ROI) study to determine the costs and net financial benefits of a geographic information system.
Return on investment is a form of benefit-cost analysis (BCA). ROI and BCA calculations provide an objective framework to understand the benefit of any enterprise. ROI is just one tool for understanding benefits. Organizations achieve their goals and objectives in many ways, but important non-financial benefits are not a part of an ROI analysis.
Early efforts to calculate GIS ROI include a method to calculate and document benefits by efficiency, effectiveness, and equity (Tulloch, et al., 1997), an analysis of ROI within the State of Montana and counties within the state (McInnis and Blundell 1998), cost benefit for Baltimore County GIS (Baltimore County 2001), and a cost/benefit analysis of GIS investment in Ghana that utilized a score and weight process based on the Investment Evaluation Methodology (Karikari and Stillwell 2005). A survey of 14 collected GIS ROI case studies was published by URISA in 2000 (Gillespie 2000).
A drawback with many early GIS ROI studies was that they were often developed and executed by highly experienced GIS practitioners who lacked recognized financial analysis competencies (Joffe 2015). Methodologies developed and promoted by GIS consultants and by the geospatial industry lacked credibility within government agency and company finance and budget departments. This limited the impact that they might have had in documenting consistent positive ROI for company management and elected officials.
A number of large government entities began the process of utilizing consulting economists and financial analysts to investigate the financial benefits from GIS and to document the results. A study of the benefits from geospatial data and technology in New Zealand identified $1.2 billion (NZ) in annual financial benefits (Smart & Craemer 2009). A study of free-of-charge street address data in Denmark identified 14 million euros in annual financial benefits (DECA 2010). A study of the contribution of geospatial data and technology use by local authorities in England and Wales identified 320 million pounds annual net benefit to the economy (Coote and Smart 2010).
At a smaller scale, based on these earlier studies, the impact of an $8.3 million (AUS) investment in geospatial in the State of Tasmania was estimated to deliver $104 million (AUS) benefits within two years (Smart 2011). At a larger national scale, an ROI analysis for Canada demonstrated $20.7 billion (CAN) in net contribution to the national economy, representing a 1.1% increase in GDP (Hickling Arthurs Low 2015).
A GIS manager should be familiar with these recent reports outlined above and with other new GIS ROI studies as they are published, as part of their portfolio of case studies to communicate the value of GIS.
5. Development of a Local Agency GIS ROI Methodology
The methodologies used for GIS ROI studies at the national or state/provincial level by non-GIS consulting firms were difficult to apply for single company or local government agency GIS operations. The need for GIS ROI analysis was demonstrated by past attempts (Gillespie 2000, Baltimore County 2001). In 2009 the Oregon Geographic Information Office and the King County GIS Center agreed to jointly fund a GIS ROI study to be conducted by a professional financial analyst or economist.
The goals of this ambitious study were to determine if the financial benefits projected in the original King County GIS Cost-Benefit analysis were achieved (PlanGraphics 1992), determine the net GIS ROI of the King County GIS program from inception to date, and develop a GIS ROI methodology that could be used for other similar studies. The King County GIS Study was conducted by a team from the University of Washington Evans Graduate School of Public Administration.
The target agency for the study was King County, Washington, which in 2010 had a population of 1.9 million and an area of more than 2000 square miles. GIS in King County began in 1992 and the study covered GIS development, implementation, and operation through 2010. The study utilized a with versus without methodology based on direct input by end-users and managers/supervisors responsible for end-user GIS activity. The methodology is described as to gauge….
At the time of the study, King County had 15,000 total employees, 30 GIS professionals, and approximately 1000 GIS end-users in more than 20 departments. The study was based on structured face to face interviews with 30 managers and supervisors who were identified as responsible for GIS use in their agencies (100% response rate), as well as an online questionnaire that was completed by 175 of the total end users sampled (39% response rate).
Based on detailed financial information, the cost of GIS planning, development, implementation, operation, maintenance, and use during the 18-year study period was more than $201 million, with an annual cost of $14,671,000 the last year of the study. These costs included the cost of the time for end-users to use GIS tools and data. The study determined that GIS generated a net financial benefit of at least $775 million over 18 years and at least $87 million in net financial benefits in 2010 . The study also determined variable ROI rates within individual departments. One department (Assessments), which mostly used GIS to maintain and publish cadastral maps showed a negative ROI. The study showed that little ROI came from map maintenance and most was derived from GIS based end-user applications. (Zerbe et al., 2015).
A study using the same methodology conducted for Multnomah County, Oregon found that the use of GIS for two emergency platforms delivered a current benefit-cost ratio of 6.73:1 for the Raptor EM system and 3.48:1 for the companion Bridge system (Zerbe et al., 2013).
By applying the Zerbe methodology, a regional GIS study of 16 local government agencies in the Puget Sound region found a current year GIS ROI range from 16.7:1 to (-)0.1:1, with an average of 3.7:1 (Babinski 2021).
Current and continuing interest in GIS ROI is demonstrated by a 10-year old URISA GIS ROI workshop, commercially available GIS ROI training and services, and a series of books on the topic (Thomas & Ospina 2004).
6. GIS ROI Methodology in Practice
The methodology based on the work of Zerbe and his University of Washington team can be applied for company and government agency GIS ROI studies. Rather than focusing on a pre-GIS (without) environment, the methodology relies on end-users conceptualizing the impact on their current (with GIS) work functions, without access to GIS technology and data.
GIS managers should have financial competencies (URISA 2012). For organizational credibility a GIS manager should partner with staff from the entity’s finance or budget department, for institutional validation of the ROI study methodology.
Most GIS ROI studies will be based on a defined recent or current time period – usually a budget year. Unlike the King County GIS ROI study, agencies can ignore past expenditures as sunk-costs.
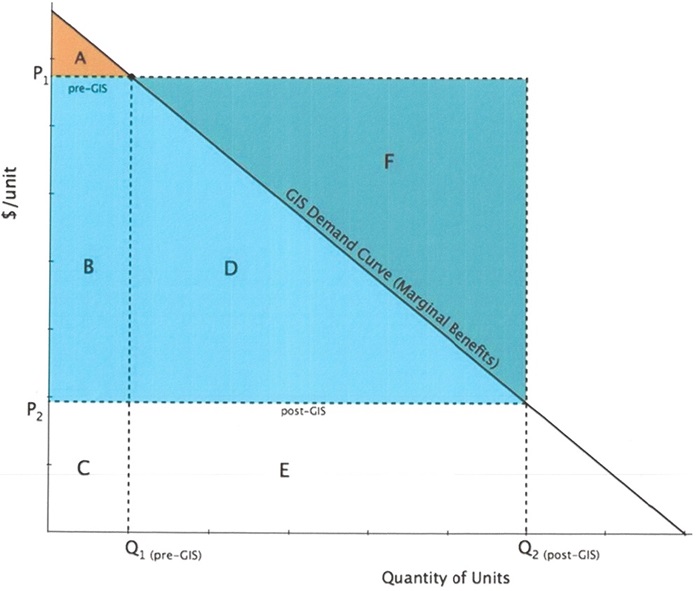
Applying the with versus without GIS methodology, the study will survey the known end-users of GIS within the agency. The theoretical basis for the with versus without methodology (Figure 3) assumes that there is some benefit to the use of maps and geographic data developed without GIS (area A). The use of GIS will lower per-unit costs from P1 to P2, and also increase the productivity of other GIS activities from Q1 to Q2. Within this theoretical model, two benefit values can be calculated. Maximum theoretical net benefits are represented by areas B, D and F. By applying a sloping demand curve that recognizes that some potential productivity gains may have marginal benefits, a lower bound range of financial benefits can be calculated (Zerbe et al., 2015).
Return on investment analysis is an estimate. The following five options describe how, with increased effort, GIS ROI data collection, and data validation, the reliability of the data analysis can be enhanced.
- Base option: Compile cost data (required for every option). Also – document and analyze the benefits data compiled from the benefit option selected.
- Basic benefits data option: A small team of core agency GIS staff and users brainstorm the number and characteristics of users across the agency and estimate themselves the cost efficiencies realized from using GIS. This is based on the assumption that core GIS staff have an understanding of the use case for the GIS tools and data employed by end-users. Identifying standard GIS user personas is also useful to categorize use cases and benefit rates.
- Enhanced basic benefits data option: A small team of core agency GIS staff and end-user department managers/supervisors brainstorm the number and characteristics of users across the agency and estimate themselves the cost efficiencies realized from using GIS. This adds in senior staff from end-user agencies as a means of increasing the validity of benefit estimates.
- Documented benefits data option: A survey interview instrument is administered face to face to knowledgeable managers or supervisors of key GIS user agencies within the agency. This includes identifying user personas within each agency and typical GIS-user practices and collaboratively estimating with versus without efficiency estimates. This process would be repeated for each end-user agency. Depending on the size of the company or agency there could be from five to more than 30 interview sessions.
- Validated benefits data option: The data compiled in options 1 and 4, above is used to develop an online GIS usage questionnaire to be sent to all GIS end-users within the Agency. Assuming that the total approximate number of GIS end-users is known, a response rate of 10-25% should provide statistically significant data.
If possible, end-user data should be organized by departments. This will allow generating GIS usage statistics and ROI estimates for sub-units of the agency, as well as the overall agency GIS ROI.
Utilizing the with versus without methodology, most end-user input (from options 2-4, above) will be compiled in terms of time saved or productivity increased with an assumed fixed time. The value of the time saved or increased productivity must be monetized as part of the analysis, based on actual or average persona labor costs.
On the cost side, the study should compile detailed costs for the core GIS infrastructure, including core GIS staff costs, hardware, software, and network costs, data acquisition and maintenance expenses, and the costs for training, consultants, and any other overhead costs. Some end-user departments may have GIS staff of their own who do work as data stewards, application developers, etc. These costs should be added also. Another cost category will be compiled from the surveys and questionaries used to determine benefits. These costs are for the time of end-users to use GIS tools and data.
In addition to GIS costs, there may be some direct financial benefits from GIS. These could include revenue from the sale of GIS data, GIS project work provided to internal or external customers for a fee, training classes, etc. While likely small, these revenues can be subtracted from agency GIS costs.
A simple structured spreadsheet template can be utilized to compile the processed raw data (Figure 4) and to display the calculated ROI benefits for the entire agency and for the designated agency subdivisions or department (Figure 5).


Part of the data analysis process is to assess the validity of end-user provided with versus without estimates. If survey responses from two or more people who work with GIS in the same business unit show varying with versus without estimates, this raises uncertainty which must be resolved by the GIS ROI report team. One approach is to generate a variety of estimates – high, low, and consensus mean or median.
Once the analysis has been completed, reviewed, and consensus approval received, a narrative report should be developed. This should include an executive summary as well as a detailed description of the process and results.
In addition to helping GIS managers communicate the value of GIS, GIS ROI studies can be used as a periodic performance metric, as part of annual budget requests for GIS, as a means to analyze the potential negative impact on ROI of reducing costs, and to analyze potential increases in ROI by new uses of GIS or by expanding the number of end-users.
References
- Antenucci, J., Brown, K., Croswell, P., Kevany, M., & Archer, H. (1991). Benefits and Costs, in Geographic Information Systems: A Guide to the Technology. New York: Van Nostrand Reinhold.
- Babinski, G. (2014). Maximizing Benefits from Municipal GIS Operations The GIS Management Institute and the GIS Capability Maturity Model. Lecture Delivered at South Ural State University, Chelyabinsk, Russia, January 21-22, 2014, (pp. 17-22).
- Babinski, G. (2021). Sound to Summit Regional GIS: Future Regional GIS Recommendations Report. Seattle: King County GIS Center, December 31, 2021.
- Baltimore Office of Information Technology. (2001). Cost Benefit: Geographic Information Systems. Business Applications Unit, Baltimore Office of Information Technology. Baltimore County, Maryland.
- Bernknopf, R., Brookshire, D., Soller, D., McKee, M., Sutter, J., Matti, J., & Campbell, R. (1993). Societal value of geologic maps. USGS Circular 1111, 53 p.
- Bhagwat, S.B. & Ipe, V.C. (2000). The economic benefits of detailed geologic mapping to Kentucky. Illinois State Geological Survey Special Report 3, 39 p.
- Burns, E. K. (1994). Linking Geographic Information Systems and Trip Reduction: Limitations in a Pilot Application. UC Berkeley: University of California Transportation Center.
- Campbell, T. (1987) Portolan Charts from the Late Thirteenth Century to 1500, Chapter 19 of The History of Cartography, Volume I. U. of Chicago Press, 74th edition (May 15, 1987).
- Chrisman, N. R. (2020). Academic Developments of GIS&T in English-speaking Countries: a Partial History. The Geographic Information Science & Technology Body of Knowledge (1st Quarter 2020 Edition), John P. Wilson (ed.).
- Coote, A. & Smart, A. (2010). The Value of Geospatial Information to Local Public Service Delivery in England and Wales. Consulting Where Limited and ACIL Tasman on behalf of the Local Government Association.
- Corvo, L., Pastore, L., Mastrodascio, M. & Cepiku, D. (2022), "The social return on investment model: a systematic literature review", Meditari Accountancy Research, Vol. 30 No. 7, pp. 49-86.
- Danish Enterprise and Construction Authority (DECA). (2010). The value of Danish address data. Consulting Report.
- GeoConnections (2015). Canadian geomatics environmental scan and value study. Canadian Geospatial Data Infrastructure, Information Product, 41e.
- Gillespie, S. R. (Editor). (2000). Determining, Measuring, and Analyzing the Benefits of GIS. Park Ridge, IL: URISA.
- Joffe, B. (2015). A Personal Account of Guidelines for Estimating GIS Return on Investment. URISA Journal 27(1).
- Karikari, I. & Stilwell, J. (2005). Applying Cost/Benefit Analysis to Evaluate Investment in GIS: The Case of Ghana’s Lands Commission Secretariat, Accra. Transactions in GIS, 9(4): 489–505.
- McInnis, L. & Blundell, S. (1998). Analysis of Geographic Information Systems (GIS) Implementations in State and County Governments of Montana. The Montana Geographic Information Council, October 1998
- Najbjerg, T. (2016) The Severan Marble Plan of Rome (Forma Urbis Romae), Stanford Digital Forma Urbis Romae Project
- PlanGraphics. (1992). King County GIS Conceptual Design. January 24, 1992 (revised April 20); King County GIS Benefit/Cost Report, July 17, 1992; King County GIS Implementation and Funding Plan, November 9, 1992.
- Smart, A. (2011). The Value of Spatial Information for Tasmania. Report prepared by ACIL Tasman, 10 October 2011.
- Smart, A. & Craemer, R. (2009) Spatial information in the New Zealand economy. Prepared for Land Information New Zealand; Department of Conservation; Ministry of Economic Development. A Consulting Report prepared by ACIL Tasman.
- Snow, J. (1855). On the Mode of Communication of Cholera (2nd ed.). London, U.K.: J. Churchill.
- Thomas, C. & Ospina, M. (2004). Measuring Up : the Business Case for GIS (1st Edition). Redlands, CA: Esri Press.
- Tulloch, D., Nieman, B. & Epstein, E. (1997). Assessing the Outcomes of MPLIS Implementation: Identifying and Describing Benefits. Esri 1997 UC Proceedings.
- Urban and Regional Information Systems Association (URISA). (2012). Geospatial Management Competency Model. URISA Journal, 1-13.
- Zerbe, R. & Bellas, A. (2006). A Primer for Benefit-Cost Analysis. Cheltenham, UK: Edward Elgar Publishing Limited.
- Zerbe, R. & Scott, T. (2011). A Primer for Understanding Benefit-Cost Analysis. Benefit-Cost Analysis Center, The Daniel J. Evans School of Public Affairs, University of Washington.
- Zerbe, R., Bodanyi, R., Ducksworth, A., Scott, T. & Singh, P. (2013). An Analysis of Benefits from the use of Raptor and Bridge Geographic Information Systems. Richard Zerbe & Associates for Multnomah County, Oregon. June 2013.
- Zerbe, R., Fumia, D., Reynolds, T., Singh, P., Scott, T., and Babinski, G., (2016). An Analysis of Benefits from Use of Geographic Information Systems by King County, Washington. URISA Journal, Vol. 27, No. 1, pp. 13-28.
Learning outcomes
-
636 - Describe the scope and importance of spatial decision-making in society
Describe the scope and importance of spatial decision-making in society
-
1692 - Explain the societal value of GIS
Explain the societal value of GIS
-
1693 - Explain the societal value of maps.
Explain the societal value of maps.
-
1694 - Explain the fundamentals of cost-benefit analysis.
Explain the fundamentals of cost-benefit analysis.
-
1695 - Describe GIS cost components.
Describe GIS cost components.
-
1696 - Describe GIS monetary benefits.
Describe GIS monetary benefits.
-
1697 - Explain how end-users can support a "with vs. without" GIS ROI analysis.
Explain how end-users can support a "with vs. without" GIS ROI analysis
-
1698 - Analyze an agency's GIS ROI.
Analyze an agency's GIS ROI.
-
1699 - Evaluate variable GIS ROI rates within an organization.
Evaluate variable GIS ROI rates within an organization.
Related topics
- [CP-04-005] Geospatial Technology Transfer Opportunities, and a Case Study of the Taghreed System
- [PD-02-012] Commercialization of GIS Applications
Additional resources
Sample GIS ROI spreadsheet template example for compiling agency GIS ROI-related input and calculating ROI value: https://www.slideshare.net/slideshows/gma-gis-return-on-investment-roi-template/265326160
GIS ROI template developed by Greg Babinski, GIS Management Academy, available for download via CC BY SA license: https://www.dropbox.com/scl/fi/dxenpqk55tq3wlrs6mpal/KE-14-GIS-Management-Academy-GisRoiTemplate.xlsx?rlkey=0ria22bxogl0mhwyb20ep9jx3&dl=0