[AM-04-099] LiDAR Point Cloud Analysis
LiDAR point cloud analysis refers to the techniques and methods used to explore LiDAR point cloud data in order to extract and visualize specific information about target features, such as land surface topography, lake bathymetry, vegetation canopy height, etc. In general, the procedures involved include noise filtering, point classification, feature extraction, quantification, and 3D reconstruction. The sequence of the procedures and the method used in each procedure can vary based on the nature of the LiDAR point cloud data, the application scenario, and the required accuracy. Recent advancements in technology, particularly drone technology, have made LiDAR data collection easier and more cost-effective. With the widespread availability of LiDAR data, point cloud analysis is facilitated by various software tools and is applied in many different domains, including urban planning, forestry inventory, biomass mapping, topography visualization, and environmental monitoring, etc.
Tags
Author and citation
Shu, S. and Wu, B. (2024). LiDAR Point Cloud Analysis. Geographic Information Science & Technology Body of Knowledge (2024 Edition). John P. Wilson (Ed.). DOI: 10.22224/gistbok/2024.1.26.
Explanation
- The Nature of LiDAR Point Cloud Data
- Noise Filtering
- Point Cloud Segmentation and Classification
- Feature Extraction, Quantification, and 3D Reconstruction
1. The Nature of LiDAR Point Cloud Data
LiDAR point cloud data refers to a collection of data points in a three-dimensional space (usually described by a coordinate system) that represent the external surface of objects captured using LiDAR (Light Detection and Ranging) technology. LiDAR sensors emit laser pulses that bounce back when they hit an object, and the time it takes for each pulse to return is used to calculate the distance to that object. This process creates a dense set of points, known as a point cloud, which accurately maps the 3D shape and features of the environment. LiDAR point cloud data can be collected by different types of LiDAR sensors onboard various platforms, such as satellite (e.g., ATLAS onboard ICESat-2), space station (GEDI onboard International Space Station), airplane (e.g., Geiger sensor), UAV (e.g., DJI Zenmuse L2 onboard DJI Matrice 350 ), mobile vehicle (e.g., RIEGL mobile scanning system), and portable ground station (e.g., Trimble X7 laser scanner). In most cases, LiDAR sensors collect two key types of information. The first is the location of the target (such as the ground surface, riverbed, or vegetation canopy) that reflects the laser pulses. This spatial data, represented by X, Y, and Z coordinates, is used to generate a the point cloud, as illustrated in Figure 1. The second type of information is the intensity and the number of the returned laser pulses, which varies based on the surface properties. Typically, solid and dry surfaces, like concrete, return single strong laser pulse, while wet or soft surfaces, such as vegetation canopies, return multiple weak laser pulses, as shown in Figure 2. The multiple laser pulse echoes are generated by the different layers of vegetations (e.g., tree branches at different heights, brushes, grasses, etc.). The density of the points in the point cloud is influenced by the sensor's capability and the platform's altitude. Generally, point density decreases from UAV-based LiDAR data to airborne LiDAR data, and further to spaceborne LiDAR data. In addition, point density also varies for different surface types. The vegetated area usually has higher point density than solid bare area due to the multiple returns generated by the different layers of vegetation.


2. Noise Filtering
LiDAR point cloud data can be noisy due to the scattering of the medium that the laser pulse travels through, such as the atmosphere or clear water. A notable example is the point cloud data collected by ICESat-2, the second satellite laser altimetry mission launched in 2018. As illustrated in Figure 3, noise points generated by the air and the water column can be easily identified. As compared to noise points, the points surrounding target surfaces (e.g., water surface and seafloor in Figure 3) are much denser. To eliminate noise and accurately identify target surfaces, a density-based filtering scheme is commonly applied (Xie et al. 2021; Xu et al. 2021). This involves using a density threshold to distinguish noise points from signal points. Various methods exist for determining this threshold, including DBSCAN (Xie et al. 2021), adaptive elevation difference thresholding (Wang et al. 2023), deep learning approaches (Zhong et al. 2022), etc.

3. Point Cloud Segmentation and Classification
Point cloud segmentation and classification is a critical step in enabling subsequent quantitative analysis. The point cloud is first segmented into meaningless clusters based on the point spatial adjacency, the intensity of returned laser pulse, and the geometry and texture of point cloud. Various methods can be applied to achieve the purpose, including K-means (Mu et al. 2020), DBSCAN (Wang et al. 2019), surface growing (Zhang et al. 2013), Hough Transform (Tian et al. 2020), and supervoxel (Liao et al. 2022), etc. After that, the clusters are categorized into meaningful classes. The classification scheme shown in Figure 4 is established by the American Society for Photogrammetry and Remote Sensing (ASPRS) and has been widely adopted for processing airborne LiDAR data.

For other types of LiDAR data, there is no universally accepted classification scheme, making point classification highly dependent on the specific application scenarios. In the case shown in Figure 3, after filtering out noise points, the remaining points are classified into categories such as land surface, ocean water surface, and seafloor. Figure 5 illustrates the classification of point cloud data collected by a vehicle-based LiDAR sensor. In this example, in addition to the standard classes of ground, building, and vegetation, the points are also categorized into classes such as street pole, vehicle, and wall, which are specific for the mobile LiDAR system and unique for this urban street environment.

buildings. (b) the area with relatively low residential buildings. Source: Wu et al. 2021.
4. Feature Extraction, Quantification, and 3D Reconstruction
Feature extraction is a key analysis that follows point classification. In this process, the target features are isolated from other classes for further quantification and analysis (Dai et al. 2018; Kang et al. 2018; Wang et al. 2015; Zhang et al. 2014). For example, when generating a Digital Terrain Model (DTM) from airborne LiDAR point cloud data, all elevated features—such as vegetation, buildings, vehicles, and power lines—must be removed. Only the ground points are extracted and interpolated to achieve the desired spatial resolution. Conversely, to generate a Digital Surface Model (DSM), the LiDAR points returned from the tops of surface features (e.g., canopy, building roofs, bare ground) are used, meaning that all elevated features are included.
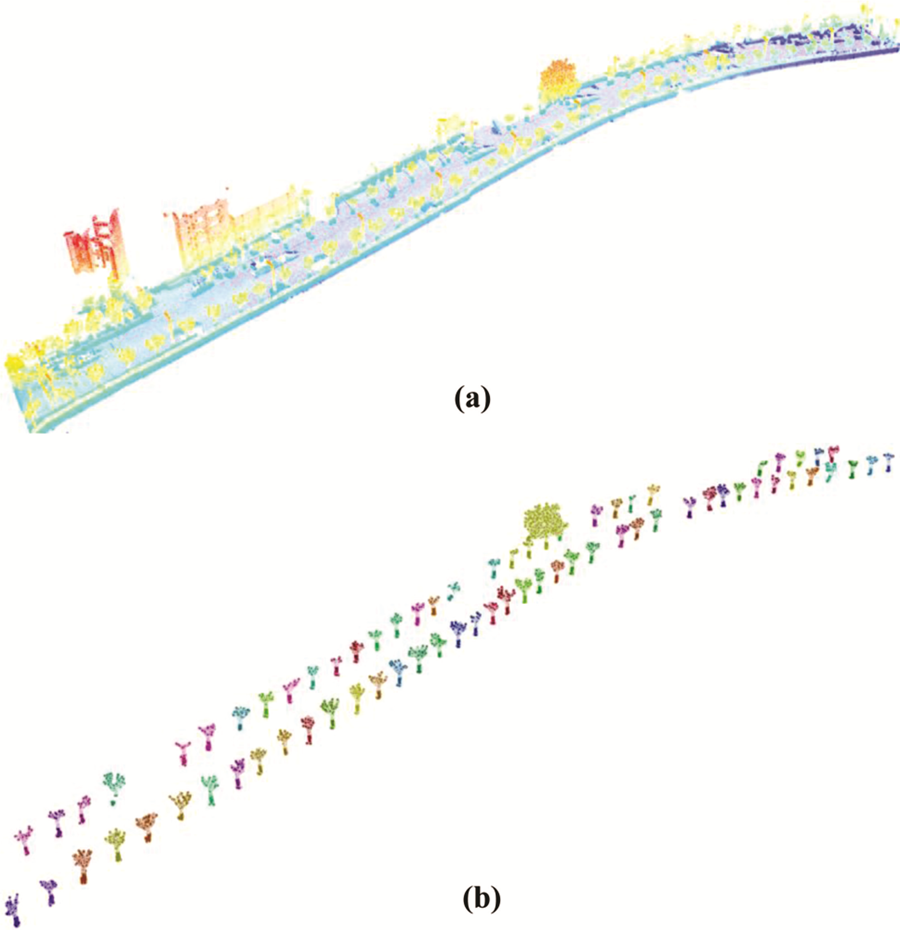
When precise delineation of a specific target feature is required, a specialized algorithm is often developed and calibrated for that feature. For example, a voxel-based algorithm was created to extract individual street trees, as shown in Figure 6 (Wu et al. 2013). Figure 7 shows the original LiDAR point cloud data and all the trees along the street identified from the point cloud data.

Once a street tree is extracted, various morphological parameters can be quantified, including tree height, crown diameter, crown base height, and diameter at breast height (DBH). For instance, Figure 8 illustrates the calculation of the DBH for a tree.

As the features are extracted and the morphologic parameters are quantified, a further analysis is to reconstruct 3D models for these features. In this process, a continuous 3D mesh or surface from the segmented point cloud data is created. Algorithms such as Delaunay triangulation (Kong et al. 2024), Poisson surface reconstruction (Kazhdan et al. 2006), or graph-based method (Wu et al. 2017) help in converting scattered points into a complete 3D shape. Figure 9 shows the 3D models of high buildings in Shanghai downtown area reconstructed from airborne LiDAR point cloud data by using a graph-based method (Wu et al. 2017). 3D reconstruction from LiDAR data is widely used in applications like urban planning, autonomous vehicle navigation, heritage site preservation, and gaming for realistic virtual environments, etc.

In summary, LiDAR point cloud analysis has become crucial for applications in fields such as autonomous driving, urban planning, and environmental monitoring. However, several challenges and research directions continue to shape its development. The first one is the issue of scalability in real-time processing and large-scale applications that usually consists of millions to billions of points. The possible solution is parallel processing or cloud computing. The second one is the integration with other sensor data for comprehensive analysis, for example RGB images collected by common cameras. The alignment of these data types can be challenging due to different resolutions, sensor types, and coordinate systems. The possible solution for this issue is data fusion, such as combining LiDAR with cameras or radar data.
References
- Dai, W., Yang, B., Dong, Z., & Shaker, A. (2018). A new method for 3D individual tree extraction using multispectral airborne LiDAR point clouds. ISPRS Journal of Photogrammetry and Remote Sensing, 144, 400-411
- Kang, Z., Yang, J., Zhong, R., Wu, Y., Shi, Z., & Lindenbergh, R. (2018). Voxel-Based Extraction and Classification of 3-D Pole-Like Objects From Mobile LiDAR Point Cloud Data. IEEE Journal of Selected Topics in Applied Earth Observations and Remote Sensing, 11, 4287-4298
- Kazhdan, M., Bolitho, M., & Hoppe, H. (2006). Poisson surface reconstruction. In Proceedings of the fourth Eurographics symposium on Geometry processing (SGP '06). Eurographics Association, Goslar, DEU, 61–70.
- Kong, G., Fan, H., & Lobaccaro, G. (2024). 3D Building Modelling from ALS Point Clouds by Delaunay Triangulation and Graph Theories. ISPRS Ann. Photogramm. Remote Sens. Spatial Inf. Sci., X-4-2024, 183-188
- Liao, L., Tang, S., Liao, J., Li, X., Wang, W., Li, Y., & Guo, R. (2022). A Supervoxel-Based Random Forest Method for Robust and Effective Airborne LiDAR Point Cloud Classification. Remote Sensing, 14, 1516
- Mu, Y., Zhou, G., & Wang, H. (2020). Canopy LiDAR Point Cloud Data K-Means Clustering Watershed Segmentation Method. ISPRS Ann. Photogramm. Remote Sens. Spatial Inf. Sci., VI-3/W1-2020, 67-73
- Parrish, C., Magruder, L., Neuenschwander, A., Forfinski-Sarkozi, N., Alonzo, M., & Jasinski, M. (2019). Validation of ICESat-2 ATLAS Bathymetry and Analysis of ATLAS’s Bathymetric Mapping Performance. Remote Sensing, 11, 1634
- Tian, Y., Song, W., Chen, L., Sung, Y., Kwak, J., & Sun, S. (2020). Fast Planar Detection System Using a GPU-Based 3D Hough Transform for LiDAR Point Clouds. Applied Sciences, 10, 1744
- Wang, B., Ma, Y., Zhang, J., Zhang, H., Zhu, H., Leng, Z., Zhang, X., & Cui, A. (2023). A noise removal algorithm based on adaptive elevation difference thresholding for ICESat-2 photon-counting data. International Journal of Applied Earth Observation and Geoinformation, 117, 103207
- Wang, C., Ji, M., Wang, J., Wen, W., Li, T., & Sun, Y. (2019). An Improved DBSCAN Method for LiDAR Data Segmentation with Automatic Eps Estimation. Sensors, 19, 172
- Wang, Z., Zhang, L., Fang, T., Mathiopoulos, P.T., Tong, X., Qu, H., Xiao, Z., Li, F., & Chen, D. (2015). A Multiscale and Hierarchical Feature Extraction Method for Terrestrial Laser Scanning Point Cloud Classification. IEEE Transactions on Geoscience and Remote Sensing, 53, 2409-2425
- Wu, B., Yu, B., Shu, S., Liang, H., Zhao, Y., & Wu, J. (2021). Mapping fine-scale visual quality distribution inside urban streets using mobile LiDAR data. Building and Environment, 206, 108323
- Wu, B., Yu, B., Wu, Q., Yao, S., Zhao, F., Mao, W., & Wu, J. (2017). A Graph-Based Approach for 3D Building Model Reconstruction from Airborne LiDAR Point Clouds. Remote Sensing, 9, 92
- Wu, B., Yu, B., Yue, W., Shu, S., Tan, W., Hu, C., Huang, Y., Wu, J., & Liu, H. (2013). A voxel-based method for automated identification and morphological parameters estimation of individual street trees from mobile laser scanning data. Remote Sensing, 5, 584-611
- Xie, C., Chen, P., Pan, D., Zhong, C., & Zhang, Z. (2021). Improved Filtering of ICESat-2 Lidar Data for Nearshore Bathymetry Estimation Using Sentinel-2 Imagery. Remote Sensing, 13, 4303
- Xu, N., Ma, X., Ma, Y., Zhao, P., Yang, J., & Wang, X.H. (2021). Deriving Highly Accurate Shallow Water Bathymetry From Sentinel-2 and ICESat-2 Datasets by a Multitemporal Stacking Method. IEEE Journal of Selected Topics in Applied Earth Observations and Remote Sensing, 14, 6677-6685
- Zhang, J., Duan, M., Yan, Q., & Lin, X. (2014). Automatic Vehicle Extraction from Airborne LiDAR Data Using an Object-Based Point Cloud Analysis Method. Remote Sensing, 6, 8405-8423
- Zhang, J., Lin, X., & Ning, X. (2013). SVM-Based Classification of Segmented Airborne LiDAR Point Clouds in Urban Areas. Remote Sensing, 5, 3749-3775
- Zhong, J., Sun, J., Lai, Z., & Song, Y. (2022). Nearshore Bathymetry from ICESat-2 LiDAR and Sentinel-2 Imagery Datasets Using Deep Learning Approach. Remote Sensing, 14, 4229
Learning outcomes
-
1755 - Explain the workflow of conducting LiDAR point cloud analysis
Explain the workflow of conducting LiDAR point cloud analysis
-
1756 - Describe the mechanism that induces noise in LiDAR point cloud data and the basic idea of filtering out noise points
Describe the mechanism that induces noise in LiDAR point cloud data and the basic idea of filtering out noise points
-
1757 - Describe the procedures of classifying LiDAR point cloud data and the difference between the clusters and the meaningful classes.
Describe the procedures of classifying LiDAR point cloud data and the difference between the clusters and the meaningful classes.
-
1758 - Explain the difference between regular point cloud classification and feature extraction
Explain the difference between regular point cloud classification and feature extraction
-
1759 - Summarize the relationship between feature extraction, quantification, and 3D reconstruction.
Summarize the relationship between feature extraction, quantification, and 3D reconstruction.