[AM-04-072] TIN-based Models and Terrain Metrics
Triangulated Irregular Networks (TINs), comprised of vertices, edges, and triangles, are widely used data structures for modeling surface morphology. This article introduces digital terrain model and analysis based on TINs, including the concept of TINs, their compositional forms, the methodologies employed in their construction, and TIN-based terrain factor extractions and applications. The construction of TINs is influenced by various methodologies, leading to the creation of distinct TIN models. Presently, the TIN based on Delaunay triangulation (D-TIN) stands as the most widely adopted model. Built upon D-TIN, a series of terrain derivative calculation methodologies have been proposed, enabling the extraction of slope, aspect, flow direction, and facilitating terrain classification. These enhancements further contribute to the scientific characterization of the morphological features and processes of the Earth's surface topography. Moreover, vectorial calculation methods have been utilized to compute surface terrain derivatives based on TINs, effectively leveraging the attribute of TIN's data structure. Finally, the main application of TIN-based terrain factors has been summarized to provide a beneficial resource for researchers and practitioners in the field.
Tags
Author and citation
Xiong, L., and Li, S. (2024). TIN-based Models and Terrain Metrics. The Geographic Information Science & Technology Body of Knowledge (2024 Edition), John P. Wilson (ed.). DOI: 10.22224/gistbok/2024.1.12.
Explanation
- Introduction
- Delaunay TIN Generation
- TIN-based Terrain Factors
1. Introduction
A triangulated irregular network (TIN) is a commonly used data structure for representing the surface morphology of objects. Especially in terrain analysis, TINs are widely used for modeling surfaces and conducting spatial analyses. A TIN model is comprised of a collection of irregularly shaped triangles that capture Earth’s complex surface. The fundamental components of TINs are vertices, edges, and triangles (Boldery and Dave, 1990). The intricate topological structure of TINs emerges from the relationships among its vertices, edges, and triangles. The data storage format of TIN not only encompasses the attribute data for each vertex but also their planar coordinates and the connectivity between triangles and their neighbors.
The generation of a triangulated network based on triangulation criteria is the primary step in constructing a TIN. Raw data are triangulated to form a TIN model in accordance with certain criteria that govern the formation of the geometric shape of a TIN's triangles and are pivotal in the overall quality of the resulting TIN. There are 6 commonly used triangulation criteria for constructing different TIN models (Figure1), according to Lee and Schachter (1980), Lawson (1977), and Watson (1981).

Previous research has theoretically proved that the maximum angle criterion, the empty circumcircle criterion, and the maximum–minimum angle criterion are equivalent. Delaunay triangulation, which utilizes the empty circumcircle criterion and the maximum–minimum angle criterion, is the most prevalent triangulation method and produces the most efficient TINs. The following contents are grounded in Delaunay triangulation.
2. Delaunay TIN Generation
2.1 Generating TIN models from points
Generating TINs from point data is a common approach (Figure 2). There are three popular algorithms to achieve this process:
- The recursive growth method operates based on the principle of initially creating a triangle, extending and enlarging it along its three sides, identifying neighboring data points to form additional triangles, and iterating until a comprehensive triangle network is formed (Brassel and Reif, 1979).
- The convex hull search method begins by identifying the minimum convex polygon that encompasses the dataset and subsequently constructs a layered triangular network outward from this polygon (Tsai, 1993).
- The incremental insertion method, which is commonly referred to as the Bowyer–Watson algorithm (Bowyer, 1981; Watson, 1981), begins by creating an initial grid from the provided point set. Subsequently, following the Delaunay triangulation principle, it progressively incorporates points within the grid and restructures to accommodate all points.

2.2 Generating TIN models from contours
Contour lines inherently contain terrain elevation information and can be regarded as discrete elevation points, facilitating the direct generation of TIN models through triangulation algorithms. Three algorithms are commonly used to generate triangulated meshes from contour lines (Figure 3) (Li et al. 2017).
- The first algorithm involves directly generating a triangulated mesh from discrete points along the contour lines.
- In the second algorithm, contour lines are regarded as feature lines that serve as break or structural lines. Each triangle can extract a maximum of two points from the same contour line.
- The third algorithm involves integrating additional features points into the TIN construction phase and optimizing the TIN structure to eliminate undesirable triangles.

2.3 Generating TIN models from grid-based DEMs
Various algorithms exist for generating triangulated meshes from grid DEMs (Figure 4), and they are implemented through two major approaches. The important point retention (Fowler and Little 1979; Molinos et al. 2021) retains useful grid points by comparing their computed importance by using a specific template. The heuristic discarding method (Aringhieri et al. 2016; Lüders and Dolag 2022) seeks the best fit between a grid DEM and the transformed TIN while imposing a limit on the number of nodes. It initiates with the entire grid DEM, iteratively calculates the contribution of each grid point to the generated TIN, and progressively eliminates less critical points until reaching either the quantity limit or a specified accuracy level.

3. TIN-based Terrain Factors
Terrain factors, such as slope and aspect, can effectively reflect the morphological characteristics of the terrain surface, model the process of geomorphological development, and reflect the terrain from different perspectives. According to previous studies, TIN-based terrain factor extraction and analysis methods can be divided into scalar-based and vector-based. This section will introduce these methods in detail.
3.1 TIN-based terrain factor calculations via scalar operations
Slope and aspect are the most commonly used and important terrain factors in geomorphometry (Xiong et al. 2022). They are normally calculated from planar triangles in accordance with geometric principles. At least three vertices are required to determine a planar triangle according to equation 1, with as coefficients and derived by solving a system of equations.
![]()
Slope and aspect can be directly obtained from a TIN and respectively calculated using the following formulas:

Hydrologic factors
Hydrologic analysis is significant in surface simulation and contains various derivatives. As a fundamental factor, flow direction is typically calculated using a maximum descent strategy based on TIN facets and vertices. The specific steps are as follows.
1. As shown Figure 5, the maximum gradient path across the triangle from point a to the initial triangle edge is calculated. Then, the negative gradient of the function is calculated and the direction of maximum descent is determined.

2. The direction of the maximum slope descent path and the line defined by the starting point of flow are projected. Then, an intersection with any edge is located to find the endpoint (point b) of the first segment of the maximum slope descent path.
3. Once the points on the edges of the triangular surfaces are determined, the gradients of the adjacent triangular surfaces are assessed.

4. After reaching a vertex, iterations are performed to test the surrounding triangular surfaces and edges to find the next flow path.
5. The maximum slope path continues in this manner until the outer boundary of the triangular terrain area is reached or a crater is encountered.
Hillshade calculation
Other terrain factors, such as hillshade, can also be calculated for surface visualizations. This method calculating shadow brightness depends on the appearance and slope of the surface elements. The specific calculation steps are as follows:
1. The slope p, q, in the x direction (east–west) and the y direction (north–south) is calculated.

2. Hillshade can be expressed through the following equation:
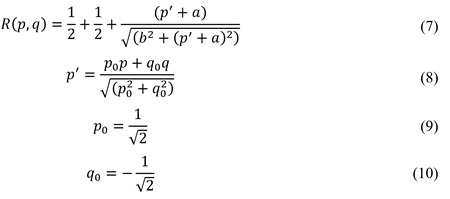
where p' is the slope in the opposite direction of the lighting source. The default lighting source is set to 45° northwest, which, although not realistic for the Northern Hemisphere, provides the best shadow in 3D space. Parameter a is the gray level of the horizontal surface, and b can be used for the gray level that changes with slope.
Terrain Classification
TIN models offer enhanced flexibility in adjusting the density and distribution of points, allowing for an accurate representation of terrain features using less data volume compared with grid DEMs. This characteristic minimizes data redundancy in flat areas, enhancing its ability in describing complex terrains. Figure 6 illustrates the outcomes of slope unit classification based on TINs. Results suggest that the TIN model-based approach effectively diminishes the influence of inconsequential gullies, ensuring a harmonious alignment between the granularity of terrain depiction and the structural scale of the terrain.

3.2 TIN-based terrain analysis via vector operations
TINs can be regarded as a combination of points and edges with their vector attribute. The calculation of terrain factors relies on the original TIN vertices to provide new insights for terrain factor calculation (Hu et al. 2022). Therefore, some studies propose the vector-based method to calculate topographic derivatives based on TINs. The calculation of slope and aspect through the vector perspective includes the following steps.
(1) The normal vector at each vertex is computed. As shown in Figure 7, a vertex Q in TIN and the corresponding vertices V0, V1, and V2 on three adjacent surfaces exactly constitute a tetrahedron Q-V0-V1-V2. As an external sphere of a tetrahedron, the center of the sphere is set as C. Then, C and any two adjacent points of the tetrahedron can form an isosceles triangle, and is the normal vector at point Q.

(2) The normal vector of TIN vertices is calculated. IF Q(0, 0, 0), v0 (, V1 (
, V2 (
, and C (x, y, z) are defined in this coordinate system, then we can calculate a vertex and obtain
. The following formula can be obtained in accordance with mathematical induction:

where is the normal vector of the
face, i.e. the cross product of the two side vectors.
is the angle between the two sides. Therefore, the normal vector of the vertex can be calculated by weighting the normal vector of the surrounding surface. The formula can be converted into the following form:

where is the area of the triangular surface, which can be calculated using Helen’s formula (Kendig, 2000).
(3) Finally, in accordance with the calculation formulas for slope and aspect, slope is calculated as follows:

where is the normal vector, and t is the angle between the projection of the normal vector on the XOY plane and the X-axis.
The results of slope and aspect obtained using the TIN vertex-based method and partially enlarged drawings are presented in Figure 8.

References
- Aringhieri, R., Grosso, A., Hosteins, P., & Scatamacchia, R. (2016). Local search metaheuristics for the critical node problem. Networks, 67(3), 209-221.
- Boldery, D. B. (1990). The elevation pyramid: a method for compressing elevation data (Doctoral dissertation, Virginia Tech).
- Bowyer, A. (1981). Computing dirichlet tessellations. The Computer Journal, 24(2), 162-166.
- Brassel, K. E., & Reif, D. (1979). A procedure to generate Thiessen polygons. Geographical Analysis, 11(3), 289-303.
- Fowler, R. J., & Little, J. J. (1979, August). Automatic extraction of irregular network digital terrain models. In Proceedings of the 6th annual conference on Computer graphics and interactive techniques (pp. 199-207).
- Hu, G., Wang, C., Li, S., Dai, W., Xiong, L., Tang, G., & Strobl, J. (2021). Using vertices of a triangular irregular network to calculate slope and aspect. International Journal of Geographical Information Science, 36(2), 382–404.
- Kendig, K. (2000). Is a 2000-year-old formula still keeping some secrets?. The American Mathematical Monthly, 107(5), 402-415.
- Lawson, C. L. (1977). Software for C1 Surface Interpolation. In Mathematical software (pp. 161-194). Academic Press.
- Lee, D. T., & Schachter, B. J. (1980). Two algorithms for constructing a Delaunay triangulation. International Journal of Computer & Information Sciences, 9(3), 219-242.
- Li, C. L., Zhu, Q., and Xie, X. (2017). Digital Elevation Modeling (3rd Edition). Beijing: Science Press.
- Lüders, S., & Dolag, K. (2022). PSI: Constructing ad-hoc simplices to interpolate high-dimensional unstructured data. Journal of Computational Physics, 467, 111476.
- Molinos, M., Navas, P., Pastor, M., & Stickle, M. M. (2021). On the dynamic assessment of the local-maximum entropy material point method through an explicit predictor–corrector scheme. Computer Methods in Applied Mechanics and Engineering, 374, 113512.
- Tsai, V. J. (1993). Delaunay triangulations in TIN creation: an overview and a linear-time algorithm. International Journal of Geographical Information Science, 7(6), 501-524.
- Watson, D. F. (1981). Computing the n-dimensional Delaunay tessellation with applications to Voronoi diagram. The Computer Journal, 24(2): 167-172.
Learning outcomes
-
1723 - Summarize the different approaches to generating TIN models.
Summarize the different approaches to generating TIN models.
-
1724 - Explain how to calculate terrain derivatives based on TIN models.
Explain how to calculate terrain derivatives based on TIN models.
-
1725 - Describe how TIN-based terrain analysis is completed using vector operations.
Describe how TIN-based terrain analysis is completed using vector operations.