[DM-07-057] Data Evaluation, Metadata, and Data Quality
The widespread availability of geospatial data through spatial data infrastructures, cloud platforms, and web services has made data evaluation a central component of GIS practice. Effective use of geospatial data depends on understanding not only spatial extent and structure, but also data quality, semantics, provenance, and usage constraints. Standardized metadata has emerged as the primary mechanism for documenting these characteristics and enabling dataset discovery, interoperability, and long-term reuse. Key dimensions of geospatial data quality include positional and attribute accuracy, logical consistency, completeness, and currency, each of which contributes to assessing fitness for use. Provenance and lineage information further support transparency, trust, and reproducibility by documenting sources, methods, and processing decisions. Emerging applications of artificial intelligence offer new opportunities to assist with metadata creation and analysis, but do not eliminate the need for human judgment in evaluating geospatial data.
Tags
Author & citation
Plewe, B. (2026). Data Evaluation, Metadata, and Data Quality. The Geographic Information Science & Technology Body of Knowledge (Issue 1, 2026 Edition), John P. Wilson (ed.). DOI: 10.22224/gistbok/2026.1.5
Explanation
- Introduction
- Data Evaluation
- Metadata
- Data Quality
- Dimensions of Data Quality
- Accuracy Assessment
- Provenance
- Implementation
- Metadata in the Discovery Process
- Streamlinng Metadata Workflows
Geospatial data are complex; in their structure, in their production, in their use, and in their relationship to the real world they are intended to represent. In today’s world data are ubiquitous and routinely shared between data producers and data users, and the inherent complexity of the data can be an impediment to wise application by users who were not involved in their creation. An incomplete understanding of an acquired dataset can easily lead to mistakes in processing and unwise conclusions. However, it is impractical to require data producers to explain every nuanced choice underlying a dataset, and to guarantee its suitability for every reasonable use.
Over time, methods and tools have emerged to document datasets and help data users understand the products they are considering using. This topic will focus on three related aspects of this:
Given the widespread availability of government spatial data infrastructures, commercial data markets, and cloud GIS platforms, users often have the choice of many possible sources for the data they need. For example, suppose you need a roads layer for Los Angeles, California. It is highly likely that you could obtain something called “roads” from Los Angeles City, Los Angeles County, the Southern California Association of Governments, the State of California, the USGS National Map, ArcGIS Online, OpenStreetMap, and commercial data providers. Although they represent the same real-world geography, these datasets will likely differ in many ways. Which one should you use, and how should it be used appropriately?
Data evaluation addresses these questions to effectively use acquired data. However, the goal is not to find the “perfect” dataset (as will be discussed below, this does not exist), but to determine how well each dataset meets the needs of a particular application, a concept known as
It is therefore crucial to begin the data evaluation process by clearly defining the data requirements for the intended application. In the above example, this might involve answering questions such as: which kinds of roads do you need? What characteristics of those roads are required? What scale(s) are you working at? What analytical tools will be used? What other datasets will the roads data be integrated with? The better you understand your needs, the better you can understand whether a dataset will meet them.
Evaluating fitness of use requires an understanding of several aspects of a given dataset:
- Access: how it can be acquired and whether it can be used legally. This may include information such as website addresses, prices, copyright, and use restrictions.
- Content: What the dataset claims to include, and conversely, what it not include. Key elements include the geographic extent, the thematic scope (which kinds of features are included and which are omitted), and the included attribute columns. For example, a “roads” dataset may only cover a single neighborhood, or only include major highways and not surface streets, or may include only the street name and no other attributes.
- Structure: How the dataset is organized, specifying its file format, attribute datatypes, coordinate system, and so on.
- Data Quality: How well the data represent reality. As will be covered in more detail below, no dataset is perfect, but the quality of different datasets varies widely. This commonly includes variables such as estimates of positional and attribute accuracy, raster cell size, precision of location and attribute measurements, and citations of data sources.
- Semantics: What the terms and measurements in the data mean. Those who created the datasets may have different conceptual models, world views, or biases than new users, so it is crucial to bridge any gaps by explaining the concepts and motivations of the former (Fisher et al., 2010). Even a concept as seemingly simple as “road” may vary from one agency or person to another, so one dataset could represent some features as roads that another does not, such as a dry creek bed or a parking lot aisle. Semantics includes information such as definitions of terms, meanings of attribute codes, units of measure, standards used for data collection, and the intended purposes.
Potential data users can take various steps to evaluate the fitness of a dataset for their use. A common and simple method is to view it in GIS software, comparing it to other data, including alternative candidates for the same layer. This can be very instructive for determining which features are represented or not represented (major highways? All roads? Parking aisles? OHV tracks?), how up to date the data are, and the set of attributes that are attached.
The primary tool used for data evaluation is metadata. Often defined by the epithet “data about data,” metadata is a set of information that documents the characteristics of a GIS dataset that directly pertain to the goals above (Aalders, 2005).
A data producer could conceivably say whatever they wanted about their data, but metadata is much more useful to both users and software if it meets consistent expectations. Thus, it is well-suited to community standards, specifying both what to include (a content standard) and how it is organized (a format standard) (Simmons, 2025). In the United States, standardization began in earnest in 1990 with the creation of the Federal Geographic Data Committee, an interagency group charged with coordinating and streamlining the GIS work across multiple federal agencies, especially data sharing between agencies and with the public (Federal Geographic Data Committee, n.d.). In 1994, this vision evolved into the National Spatial Data Infrastructure (NSDI). Recognizing the importance of metadata in this infrastructure, FGDC developed the Content Standard for Digital Geospatial Metadata (CSDGM) (Federal Geographic Data Committee, 1998).
While public data sharing is an important reason that governments have typically been the driving force in metadata development, they also have internal needs for metadata. For example, better documentation aids interoperability between agencies, to integrate data that were originally created for disparate purposes. Prior to metadata and SDIs, agencies often spent valuable resources producing redundant datasets tailored to their own needs. Metadata is also important for training new staff who need to become productive users and creators as quickly as possible.
Other countries soon developing similar standards (Moellering et al., 2005), leading to coordination by the International Standards Organization. The result is ISO 19115: Geographic Information – Metadata, first released in 2003 (International Organization for Standardization, 2014). Most national standards are now based on ISO 19115, including the United States (INCITS, 2014). This standard extends earlier efforts by adding controlled vocabularies for subjects and other keywords, refined prioritization of required and optional elements, and more modern options for encoding metadata into computer-readable files.
Geospatial metadata content is also being incorporated into general-purpose metadata standards, especially by agencies that create a wide variety of public datasets beyond GIS data. The U.S. Data Catalog Application Profile (DCAT-US), created by a U.S. Department of the Interior committee called the FAIRness Project, is an example of a general metadata standard that can document geospatial datasets alongside non-spatial files in data warehouses and data catalogs (US Department of the Interior, n.d.). It combines elements from both geospatial standards like CSDGM and ISO 19115 and non-spatial standards such as Dublin Core (Dublic Core Metadata Initiative, 2020). It also specifies how the metadata should be structured and shared between senders (data producers) and receivers (search engines). The popular term FAIR (Findable, Accessible, Interoperable, Reusable) is an encapsulation of the ideals of spatial data infrastructures, including metadata (GO FAIR, 2022).
The original FGDC Content Standard and ISO 19115 organize the prescribed content of metadata documents into similar sections (Earth Sciences Information Partners, 2017):
- Metadata Reference (MD_Metadata in ISO 19115): information about the metadata document itself, such as authorship, release date, and bibliographic citation. In ISO 19115, this object also contains the others.
- Identification (MD_DataIdentification): basic description of the dataset, including its title, spatial extent, subject matter, bibliographic citation, use restrictions, and so on.
- Data Organization (MD_SpatialRepresentation): how the dataset is structured (vector, raster, geometry type, etc.), including the file format.
- Data Quality (MD_DataQualityInformation): information about the fidelity of the data to reality and how the data producer assessed this. See below for more information.
- Spatial Reference (MD_ReferenceSystem): The coordinate system used for the data, including map projection, horizontal and vertical datums, and spheroid parameters (see DM-05 Spatial Reference Systems).
- Attributes (MD_ContentInformation): A list of the attributes describing each item in the dataset, including datatypes and allowed values.
- Distribution (MD_DistributionInformation): How the dataset is distributed and can be accessed by other users, whether through the Internet or offline.
Each section can be more or less important in different situations. For example, since many of the earliest developments of SDI and metadata were in the context of the United States federal government, with its nearly universal public domain data policy, use restrictions documentation was often overlooked. However, the modern geospatial ecosystem is filled with government, open (to various degrees), and commercial data sources, and multiple derivations therefrom. It is therefore very important to clearly document data licensing and rights protection regimes (such as Creative Commons), even for data that is ostensibly “free.”
As mentioned above, data quality is an important characteristic of a dataset, and deserves closer attention. Data quality can be defined as an assessment of how well a dataset represents the real world. While the person or agency that originally created the dataset may be innately comfortable with their work, it is rarely obvious to other users whether they can or should trust it enough to use it. Because of its importance, data quality (and associated metadata) has its own ISO standards (International Organization for Standardization, 2023). The basic principles of error and uncertainty, and how they are typically managed in GIS analysis and modeling, are covered elsewhere in this Body of Knowledge. Therefore, the focus here is on how quality is measured and documented in metadata.
No geospatial dataset is a perfect representation of the real world. Reality is just too complex to be fully captured; every observation tool (including our own senses) is limited; and the world constantly changes, so every measurement begins to age immediately. Every GIS dataset is therefore an approximation, and all data contain
Fortunately, these limitations do not invalidate GIS data and analysis. Our geospatial techniques, including GIS analysis, statistics, and cartography, are insensitive to some degree to error and uncertainty. That is, a small change in data values does not significantly change the result. See, for example, Clarke (2019) for more on sensitivity. Any GIS application can thus tolerate some degree of uncertainty, but how much is acceptable depends on the project. The key is that the data are “good enough” to produce analytical results that correspond closely to results in the real world. In practice, this means results can be “correct” even if the data is not. This results-based notion of “good enough” means that documenting data quality is more nuanced than branding a dataset as “accurate” or “correct” (or “wrong”); it means providing sufficient information to enable potential users to evaluate its fitness for use for a particular need.
Data quality evaluation typically addresses several goals, corresponding to desirable aspects of the ideal dataset that may be met to some degree:
- Attribute Accuracy: The degree to which attribute values match real-world values. While some values may be exactly correct (especially nominal attributes like names or categories), other attributes will have error (asserts 10.535 but really 10.834) or imprecision (asserts 11, really 10.834) due to imperfect measurement devices and methods.
- Positional Accuracy: The degree to which data locations and shapes match their true counterparts. Error and imprecision are inherent to all sources of location measurement, such as GNSS (see Topic DC-02-003 Global Navigation Satellite Systems for discussion of such errors), maps, and remote sensing imagery.
- Logical Consistency: The extent to which the included features relate to each other in space, time, and attribute. This includes the topological relationships between features (see Topic DM-01-028 Topological Relationships), such as governmental jurisdictions being adjacent to each other with no overlap and no space between. Other types of consistency errors (e.g., A says population > B but actually A<B) can also appear, but it is also possible to have data that are internally consistent, even if every value is not perfectly accurate.
- Completeness: The extent to which all of the features and attributes are included in the data. It is possible for a dataset to be complete, but it is also common to accidentally exclude features or have blank attributes (Brassel et al., 1995).
- Currency: How up-to-date the data are relative to the present state of the world, of an intended historical time period. Data can become out of date the moment after they are collected, but can be recent enough to show little difference with the present. For intentionally historical data, then intended valid time period should be documented.
In each of these aspects, it is important that data producers are honest in reporting the quality of their data, including not only positive claims, but also known shortcomings. For example, metadata may include an appraisal of how often the dataset is typically updated, even if it is relatively infrequent; or it may explain the decision process for why some features were not represented, or why a certain collection method was used when more precise and accurate methods exist. These explanations can be just as valuable for fitness-for-use decisions as claims of high quality.
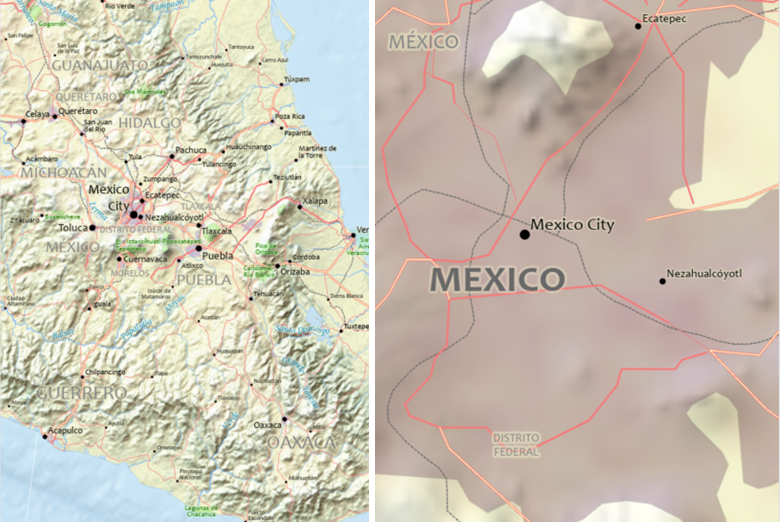
Some datasets are designed to meet these goals as closely as humanly possible, while others are intentionally less perfect to meet particular goals. This latter case is most common in smaller-scale data that covers a larger scope, where data must be generalized to be of practical use (Figure 1). That said, even generalized data is meant to appear correct at their intended scale, so data quality assessment is still relevant.
Perfect assessment of data quality is impossible for the same reasons that datasets are imperfect: if we could determine every error, we could just correct them all. While such data cleaning is possible for some aspects such as topological consistency, it is generally infeasible to “fix” every attribute and location.
Therefore, the most common strategy for estimating data quality is ground truthing or ground verification, in which a small sample of the dataset is selected. This subset is then re-measured using devices or methods known to be of much higher accuracy and precision (but infeasible to re-collect the entire dataset), producing a sample of ground truth or ground control. The discrepancies that are found can then be measured and incorporated into statistical models to infer the amount of error across the original dataset.
For quantitative measurements, especially locations, a very common and relatively simple measure of error and consistency is root-mean-square error (
For qualitative (especially categorical) data, the ground truth sample is often summarized in a confusion or error matrix that tallies each sample’s data and ground truth values, which can then be analyzed using statistics such as Cohen’s Kappa, which compares the overall categorical accuracy to what would occur by chance (Cohen, 1960). For more information about this method applied to both GIS and remote sensing data, see Zhang (2020) and Stehman (2020).
An alternative approach is to define an acceptable error threshold for a given scale or purpose, as found in national map accuracy standards (USGS, 1999). Then the percentage of the ground truth sample that is within the threshold is used as an estimate of the probability of the rest of the dataset being within the threshold.
Some forms of data are derived from samples using robust methods, such as inferential statistics and interpolation, that have known error probability models that can be reported. A widely familiar example is a confidence interval reported from a political survey, such as “46%(±4%) approve,” estimated based on factors such as the sample size.
Rigorous accuracy assessments like those described above are not always feasible for every aspect of a dataset, and are not always necessary to determine fitness for a given use. A less direct approach is to establish trust that the dataset was created using reliable methods by competent producers. This can be partially achieved through metadata that describes the
Documentation of provenance may include descriptions of the source materials (whether digital or paper), the step-by-step procedures used to derive the final product, the standards used by the producing agency, and sometimes even the qualifications of the data producers (Gil et al., 2010). The goal is not to force data users to have blind trust in the producer, but to provide sufficient information for potential users to evaluate the source of the data and decide whether it is sufficiently trustworthy for the needed purpose.
Provenance can have useful purposes beyond data evaluation (Tullis and Kar, 2021). First, it is simply ethical for data producers to be honest about their sources and methods. Second, it facilitates the reproducibility of the data by enabling others to recreate and independently verify the data. Reproducibility has become a major issue in modern science (including GIScience), where occasionally dubious results have been claimed that may have been derived incorrectly and thus warrant independent verification (Ostermann et al., 2021). Better metadata, including provenance information about processing and analysis procedures, is on key to increasing reproducibility (Wilson et al., 2021).
As academic journals increase their expectations relating to open science and reproducibility, there will likely be a greater demand for scholars to produce standards-based metadata for their research products, expanding metadata creation beyond traditional government agencies (Kedron et al., 2026). The “five star” framework of Wilson et al. (2021) offers some flexibility for new metadata creators by outlining several levels of increasing rigor in provenance-focused metadata for publishing reproducible GIScience.
Metadata appear in the geospatial data ecosystem in a few common ways, depending on how humans or software are expected to use it. The most basic, and probably most common, form is a short human-readable description of the dataset (corresponding to the two-star level in the framework of Wilson et al., 2021). This may be as basic as text on the web page from which the dataset is downloaded. It rarely conforms to any structure or content standards, and usually provides only basic information such as the file format, coordinate system, a general description of the original purpose of the dataset, or a list of attributes. Although incomplete, it is relatively easy to create, find, and understand.
A second approach is to integrate selected metadata elements directly into the GIS data files. This has always been common for information that is crucial for GIS software to accurately manage, display and analyze the data. Typically, this information is stored in a
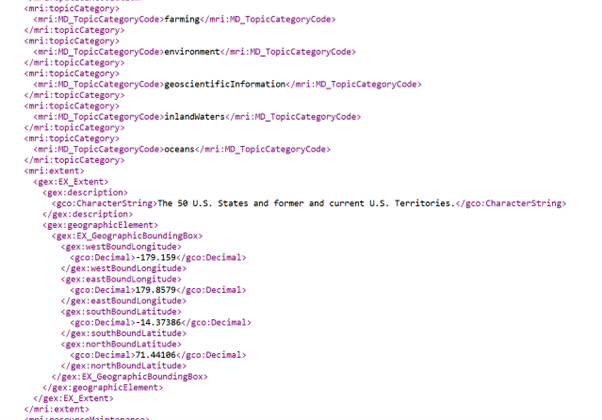
A third form of metadata, the most complete (4-star in Wilson et al., 2021), is a fully standards-based document that accompanies the dataset (known as a sidecar file). This file itemizes the characteristics of the dataset one by one, typically precisely following the hierarchical outline of a given metadata content standard such as ISO 19115. Originally, these were typically text files of hierarchical bullet lists, but today they are usually encoded in machine readable structured text formats such as Extensible Markup Language (XML) (Figure 2) or JavaScript Object Notation (JSON) (International Organization for Standardization, 2019).
9. Metadata in the Data Discovery Process
Metadata was long been central to spatial data infrastructures and data discovery tools; in fact, the earliest spatial data search engines were often called metadata clearinghouses. As SDI platforms have evolved, their reliance on high-quality metadata has only increased. The more documentation that is provided, the more there is to match with the searcher’s requests.
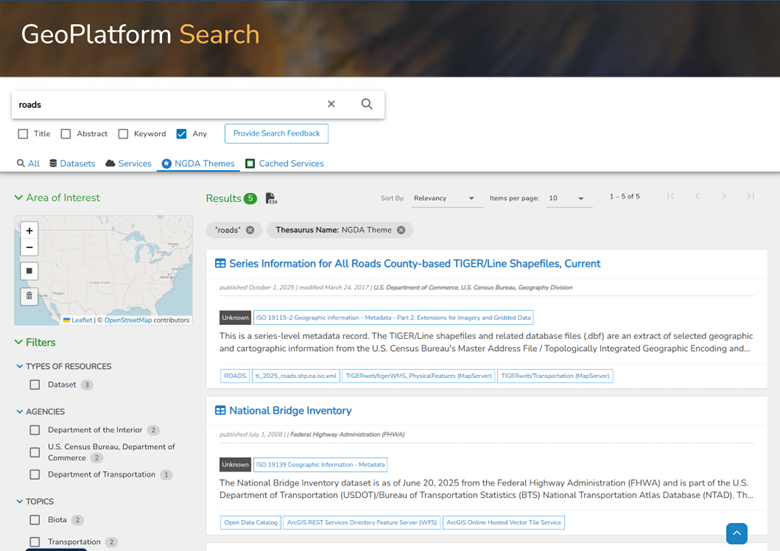
Machine-readable metadata has a greater value in the discovery process, because it enables key metadata elements to be leveraged more directly than free-text search (Plewe and Johnson, 1998). For example, geoplatform.gov, a typical modern geodata discovery service (Figure 3), starts with a basic keyword search, then adds spatial query using the spatial extent element in the metadata, and faceted query that filters the search results based on common metadata categories (in the figure, Types of Resources, Agencies, Topics, but others such as publication date, copyright, fees, and scale are also common). Metadata is also used to format the results to show the most important characteristics of each candidate as simply as possible. The primary goal of these data discovery platforms is to identify a small set of data sources that have the highest likelihood of fitness for use, reducing the time spent on the more time-consuming parts of data evaluation, such as reading complete metadata documents or physically downloading and experimenting with the data.
10. Streamlining Metadata Workflows
The primary challenge of effective metadata is that creating and maintaining it is time-consuming, and it is often seen as a distraction from the core business of developing the dataset itself. Most metadata standards specify required and optional elements, but this often results in metadata documents being limited to only a few core elements that are most crucial to the discovery and evaluation processes.
To aid in the process of creating better metadata, many GIS software programs include tools to create metadata documents as the data themselves are being created (Esri, n.d.; QGIS 2026). Some elements may be automatically generated from the dataset itself, such as the coordinate system and a list of attributes with data types. However, most of the elements still require manual entry based on personal and institutional knowledge external to the data, so the software may provide formatted editing tools to facilitate such entry in compliance with one or more standards.
Alternatively, specialized open-source programs such as mdEditor (https://www.mdeditor.org/) and the USGS Metadata Wizard (https://www.usgs.gov/software/metadata-wizard) are also available for editing metadata documents. These can be helpful in guiding new creators through the many elements of a complete metadata record, and they handle the file encoding. However, they tend to lack the ability to automatically pull elements directly from the data, and like many small, specialized programs in the open source market, they may not be maintained in the long term (Holler and Kedron, 2022).
Emerging technologies could revolutionize the relationship between geospatial data and their metadata. For example, a common form of metadata in general search engines is embedded machine-readable semantics. Often associated with the Semantic Web movement of the late 2000s and early 2010s, this approach encodes meaning—definitions, relationships, and identifiers—directly into data using shared vocabularies or formal ontologies (see Zhang, 2019). Initially, the idea of a “Semantic GeoWeb” promised geospatial data that was inherently meaningful to software: features linked by shared identifiers, well-defined concepts, and formal relationships based on machine-readable ontologies, essentially completely fusing the data and the metadata (Stadler et al., 2012). In theory, this would allow data from different agencies, scales, and domains to interoperate seamlessly, enable automated reasoning (“find all flood-prone hospitals downstream of a dam”), essentially bypassing the need for both data evaluation and traditional metadata.
While this vision proved difficult proved difficult to implement at scale (Hogan, 2020), many of the underlying ideas have persisted in forms that are more lightweight, targeted, and practical, such as knowledge graphs and JSON-LD (JSON for Linked Data) embedded in otherwise ordinary web data. Their incorporation into modern search engine optimization (SEO) algorithms has led to their widespread adoption (see Huang and Zhu, 2025). Thus, this is a platform for geospatial metadata that can be more easily automated than traditional documents (Coene et al., 2020).
Because metadata is largely textual, large language model (LLM) artificial intelligence tools have great potential for both the creation and the evaluation of metadata documents. While an AI cannot read the minds of the people who created the dataset, it could likely harvest useful information from a corpus of documentation surrounding its creation, such as transcriptions of online meetings or e-mail discussions of the data. AI could also streamline the data evaluation process, by comparing metadata documents from candidate datasets and summarizing their similarities and differences. These applications have not yet been fully explored in the literature, but one application of AI that has been developed to some degree is in data quality assessment procedures such as those described above (e.g., Hosseinali et al., 2010); the procedures of extracting ground truth samples and the statistical analyses required are very automatable.
None of these approaches eliminate the need for human judgment in our creation, discovery, evaluation, and use of geospatial data. For the foreseeable future, AI-generated metadata will be incomplete, requiring human data stewards to finish it by filling in the gaps. AI-analyzed metadata would automate some parts of the data evaluation process, but human users still need to make the final decisions on what data is most fit for their purposes.
Ultimately, the effective use of geospatial data depends not on finding a single “best” dataset, but on understanding how well a dataset fits a particular purpose. Metadata, data quality measures, and provenance information provide the tools for making this judgment, but they do not replace it. As data sources continue to expand and become more accessible, the role of the GIS practitioner increasingly involves interpreting these signals—evaluating not only what the data contain, but how they were created, what they mean, and how much uncertainty they carry. In this sense, data evaluation remains a fundamentally human process, supported—but not supplanted—by standards, tools, and automation.
References
- Aalders, H.J.G.L. (2005). An Introduction to Metadata for Geographic Information. In Moellering, H., H.J.G.L. Aalders, A. Crane, eds. World Spatial Metadata Standards: Scientific and Technical Descriptions, and Full Descriptions with Crosstable, Pergamon and International Cartographic Association. DOI: 10.1016/B978-0-08-043949-5.X5000-1
- Brassel, K., Bucher, F., Stephen, E., and Vchovski, A. (1995). Completeness, in Elements of Spatial Data Quality, by Guptill, S.C. and J.L. Morrison (Eds.). New York: Oxford Elsevier Science, 81-108.
- Clarke, K. (2019). GIS-Based Computational Modeling. The Geographic Information Science & Technology Body of Knowledge (3rd Quarter 2019 Edition), John P. Wilson (ed.).
- Coene, Y., Voges, U., & Barois, O. (Eds.). (2020). OGC EO dataset metadata GeoJSON(-LD) encoding standard (OGC Standard No. 17-003r2, Version 1.0). Open Geospatial Consortium.
- Cohen, J. (1960). A coefficient of agreement for nominal scales. Educational and Psychological Measurement. 20 (1): 37–46.
- Devillers, R. and Goodchild, H., eds. (2010). Spatial Data Quality: From process to decisions. Boca Raton: CRC Press.
- Dublin Core Metadata Initiative. (2020). DCMI metadata terms.
- Earth Science Information Partners (ESIP). (2022). ISO 19115 explorer.
- Esri (n.d.) Geodatabase architecture, ArcGIS Pro Documentation.
- Esri. (n.d.). Best practices for editing metadata. ArcGIS Pro Documentation.
- Federal Geographic Data Committee (FGDC). (1998). Content Standard for Digital Geospatial Metadata (FGDC-STD-001-1998). FGDC: Washington, D.C.
- Fisher P., Comber A., and Wadsworth R., (2006). Approaches to uncertainty in spatial data. Fundamentals of spatial data quality, R. Devillers and R. Jeansoulin eds., ISTE: London, 43-59.
- Gil, Y., J. Cheney, P. Groth, O. Hartig, S. Miles, L. Moreau, and P. Pinheiro da Silva, eds. (2010). The Foundations for Provenance on the Web. Foundations and Trends in Web Science 2 (2–3):99–241.
- GO FAIR. (2022). FAIR principles [Overview].
- Guptill, S.C and Morrison, J.L. eds. (1995) Elements of Spatial Data Quality, International Cartographic Association. 1st Edition. Pergamon-Elsevier.
- Hogan, A. (2020). The Semantic Web: Two decades on. Semantic Web, 11(1):169-185.
- Holler, J. and Kedron, P. (2022). Mainstreaming Metadata into Research Workflows to Advance Reproducibility and Open Geographic Information Science, Int. Arch. Photogramm. Remote Sens. Spatial Inf. Sci., XLVIII-4/W1-2022, 201–208.
- Hosseinali, F., Alimohammadi, A., Aleskheikh, A. A. (2010). Assessing Geometric Uncertainty in GIS Analysis Using Artificial Neural Networks, in Devillers, R. and H. Goodchild (Eds.) Spatial Data Quality: From Process to Decisions, Boca Raton: CRC Press, 87-95.
- Huang, W. and Zhu, R. (2025). Geospatial Knowledge Graphs. The Geographic Information Science & Technology Body of Knowledge (Issue 2, 2025 Edition), John P. Wilson (ed.).
- International Organization for Standardization. (2014). Geographic information — Metadata — Part 1: Fundamentals (ISO Standard No. 19115-1:2014).
- International Organization for Standardization. (2019). Geographic information — Metadata — XML schema implementation — Part 1 (ISO Standard No. ISO/TS 19139-1:2019).
- International Organization for Standardization. (2023). Geographic information — Data quality — Part 1: General requirements (ISO Standard No. 19157-1:2023).
- Kedron, P., Li, Z., and Liu, L. (2026). The computational reproducibility of articles published under the Open Data + FAIR policy of IJGIS, International Journal of Geographic Information Science, January 2026, 1-22.
- Moellering, H., Aalders, H. J. G. L., and Crane, A. eds. (2005). World Spatial Metadata Standards: Scientific and Technical Descriptions, and Full Descriptions with Crosstable, Pergamon and International Cartographic Association.
- Ostermann, F. O., Nüst, D., Granell, C., Hofer, B., and Konkol, M. (2021). Reproducible research and GIScience: An evaluation using GIScience conference papers, In 11th international conference on geographic information science (GISience 2021). Vol. 208, Part 2, ed. K. Janowicz and J. A. Verstegen, 2:1–2:16. Dagstuhl, Germany: Schloss Dagstuhl – Leibniz-Zentrum für Informatik.
- Plewe, B.S., and Johnson, S.R. (1999). Automated Metadata Interpretation to Assist in the Use of Unfamiliar Gis Data Sources. In: Goodchild, M., Egenhofer, M., Fegeas, R., Kottman, C. (eds) Interoperating Geographic Information Systems. The Springer International Series in Engineering and Computer Science, vol 495. Springer, Boston, MA.
- QGIS Development Team. (2026). Metadata tools. QGIS Documentation.
- Simmons, S. (2025). Geospatial Content Standards. The Geographic Information Science and Technology Body of Knowledge (Issue 2, 2025 Edition), John P. Wilson (Ed.).
- Stadler, C., Lehman, J. , Höffner, K., and S. Auer, 2013. LinkedGeoData: A core for a web of spatial open data, Semantic Web, 3:333-354.
- Stehman, S. (2020). Ground Verification and Accuracy Assessment. The Geographic Information Science & Technology Body of Knowledge (1st Quarter 2020 Edition), John P. Wilson (ed.).
- Tullis, J. A., & Kar, B. (2021). Where is the provenance? Ethical replicability and reproducibility in GIScience and its critical applications. Annals of the American Association of Geographers, 111(5), 1318-1328.
- U.S. Department of the Interior. (n.d.). DCAT-US version 3: Data catalog application profile for the United States of America (Candidate Recommendation Snapshot). DOI FAIRness Project.
- United States Geological Survey (USGS). (1999). Map Accuracy Standards, USGS Fact Sheet 171-99, November 1999. Accessed June 2021.
- Wechsler, S. (2021). Error-based Uncertainty. The Geographic Information Science & Technology Body of Knowledge (3rd Quarter 2021 Edition), John P. Wilson (ed.).
- Wilson, J. P., Butler, K., Gao, S., Hu, Y., Li, W., and Wright, D. J. (2021). A Five-Star Guide for Achieving Replicability and Reproducibility When Working with GIS Software and Algorithms. Annals of the American Association of Geographers, 111(5): 1311-1317.
- Zhang, C. (2019). Ontology for Geospatial Semantic Interoperability. The Geographic Information Science & Technology Body of Knowledge (4th Quarter 2019 Edition), John P. Wilson (ed.).
- Zhang, Z. (2020). Thematic Accuracy Assessment. The Geographic Information Science & Technology Body of Knowledge (2nd Quarter 2020 Edition), John P. Wilson (ed.).
Learning outcomes
-
2021 - Explain the ways in which metadata increases the value of geospatial data
-
2022 - Outline the elements of a national or international geospatial metadata standard
-
2023 - Evaluate candidate data sources for a given project using metadata and other resources
-
2024 - Assess the positional and/or attribute accuracy of a dataset using a ground truth sample or other appropriate method
-
2025 - Generate partial metadata documents using automated tools in GIS software
-
2026 - Create a complete metadata document for a geospatial dataset